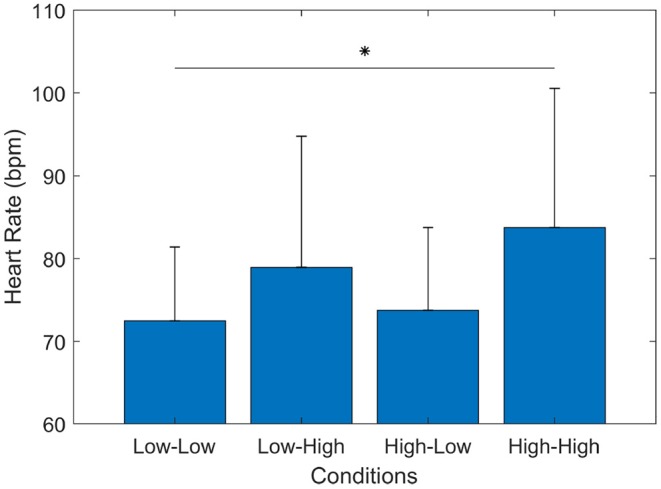
Figure 5.

Subjects' heart rate (HR) in beats per minute (bpm). The bar graph represents the mean and the standard deviation of participants' HR during the four experimental conditions. The Wilcoxon test showed a significant increase between High-High and Low-Low (p = 0.003) conditions. *p < 0.0083.
