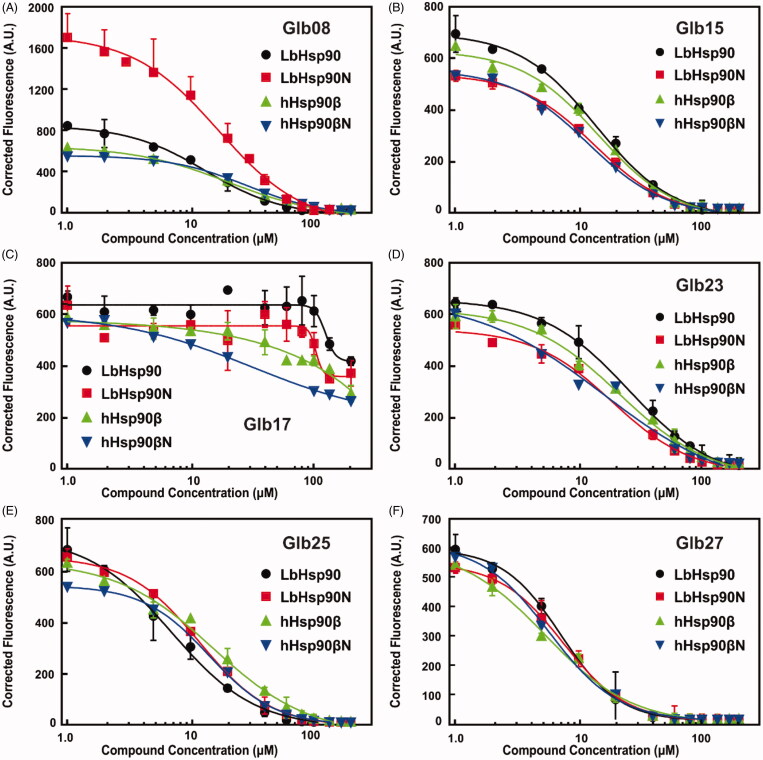
Figure 4.
Protein interaction with ligands monitored by the Tryptophan Fluorescence Quenching. The protein fluorescence was monitored in the presence of increasing ligand concentrations and the KDapp was determined as described in Material and Methods section (Equation (3). (A) GLb08, (B) GLb15, (C) Glb17, (D) Glb23, (E) Glb25 and F) Glb27. The continuous line represents the non-linear fitting adjustment with Equation (3) performed by the GrapPrism 6 software.

