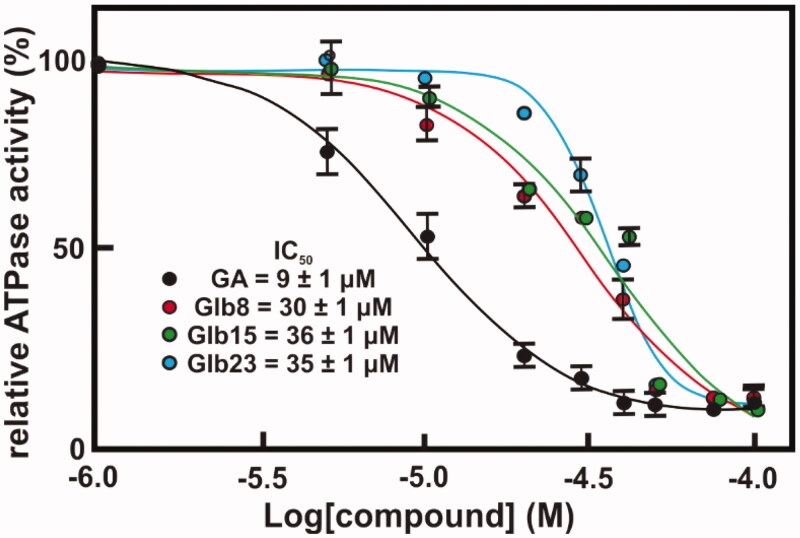
Figure 6.
Concentration–response curves of compounds against LbHsp90 ATPase activity inhibition. The ATPase activity inhibition of LbHsp90 was determined as described in Material and Methods section. Concentration-response curve of four compounds, namely (A) Glb08, (B) Glb15, (C) Glb23 and (D) GA. The absolute IC50 value was determined by nonlinear regression analysis employing GraphPad Prism 6 software.

