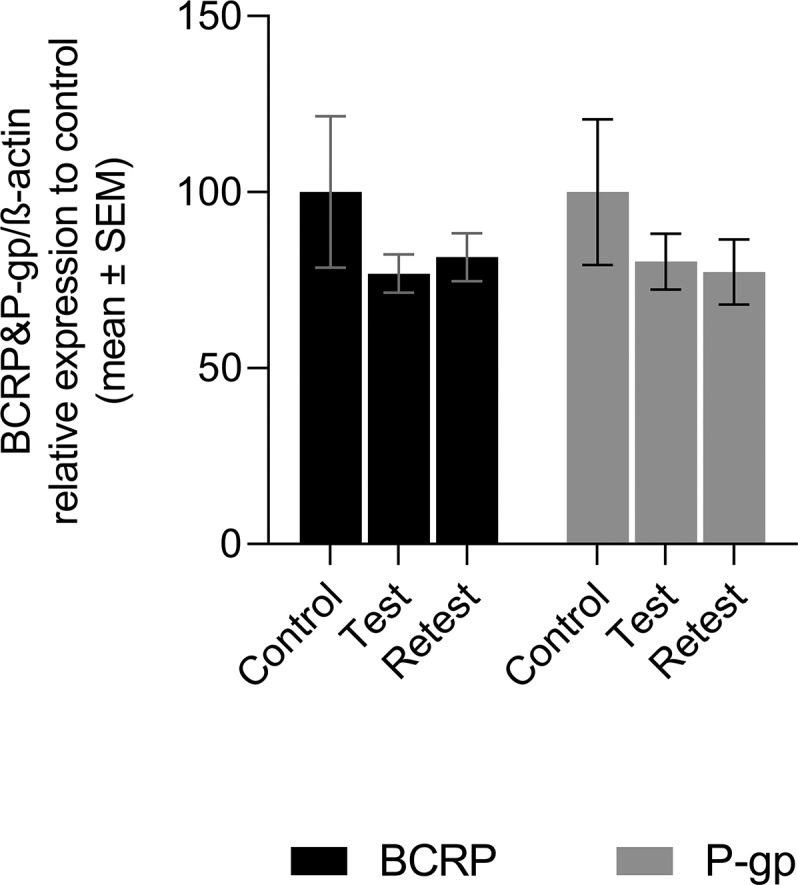
Figure 7.

BCRP and P-gp expression in control animals, group “Test” (one time anesthetized) and group “Retest”(twice anesthetized). Expression was related to β-actin and then normalized to protein expression found in control animals. Data are shown as mean ± SE (n per group = 4 with duplicates).
