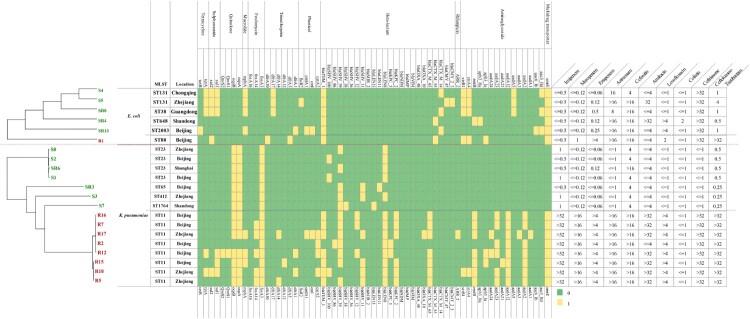
Figure 3.
Evolutionary relationships, antibiotic resistance genes, distribution and MIC values of K. pneumoniae and E. coli strains. Evolutionary relationships, antimicrobial resistance genes and MICs are shown on the left, middle and right, respectively. Strains are colour coded on the tree (CRE, red; CSE, green). Each row of the heatmap (middle) indicates a strain, and each column represents an antibiotic resistance gene that belongs to the indicated functional clusters shown at the top. The colour intensity shows the copy number of the antibiotic resistance gene.

