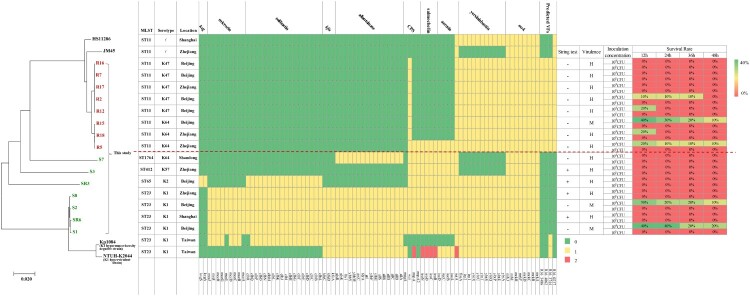
Figure 6.
Virulence gene distribution and virulence assay of 15 K. pneumoniae strains in a G. mellonella infection model. Evolutionary relationships, virulence genes and virulence phenotypes are shown on the left, middle and right, respectively. Two K1 hypervirulent and two ST11 online complete genomes were selected from the NCBI GenBank as references. Our 15 strains are colour coded on the tree (CRKp, red; CSKp, green). Each row of the heatmap (middle) indicates a strain, and each column represents a virulence gene that belongs to the indicated 10 functional clusters shown at the top. The colour intensity shows the copy number of the virulence gene. The virulence assay was conducted using the G. mellonella infection model, and the survival rates of G. mellonella infected with the respective strains are shown on the right.

