Figure 3.
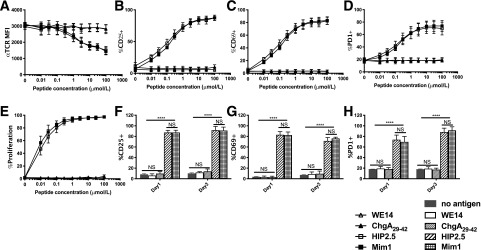
BDC2.5 Tg splenic T cells mount strong responses to the HIP2.5 epitope but no observable responses for the WE14 and ChgA29–42 epitopes. A–E: Dose-response curves of BDC2.5 splenic T cells to WE14, ChgA29–42, HIP2.5, and Mim1 at day 1 poststimulation by corresponding peptides. The HIP2.5 peptide elicited similarly strong responses to the mimotope in TCR downregulation (A), upregulation of CD25 (B), CD69 (C), and PD1 (D), and proliferation (E). MFI, mean fluorescence intensity. F–H: Comparison of T-cell responses between day 1 and day 3 poststimulation. Data shown are for 100 μmol/L peptide concentration (no antigen as a control). Lines and error bars represent mean and SEM from three experiments (with three, three, and two mice per experiment). For CD25, CD69, and PD1, there was no statistical difference between any pair of no antigen, WE14, and ChgA29–42 conditions or between Mim1 and HIP2.5 conditions; in contrast, there was a significant difference between any one of no antigen, WE14, and ChgA29–42 conditions and either Mim1 or HIP condition. ****P < 0.0001.

