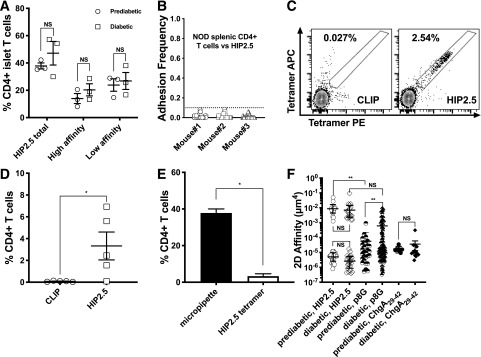
Figure 6.
Bimodal distribution of HIP2.5 affinity for polyclonal NOD T cells. A: The frequency of HIP2.5-specific cells in the islets of prediabetic and diabetic NOD mice, where the line is the mean value and each dot represents data from one experiment (one mouse). In addition to the frequency of total HIP2.5-specific T cells, antigen specificity was also reported for high– and low–2D affinity T cells for the HIP2.5 defined in panel F. B: NOD splenic CD4 T cells do not bind to the HIP2.5 epitope. Enriched splenic CD4 T cells from three prediabetic NOD mice were tested for HIP2.5 reactivity, but none was a binder. C and D: HIP2.5 tetramer staining of prediabetic NOD islet CD4 T cells. Panel C shows representative flow plots (CLIP as a control). PE- and APC-conjugated tetramers were both used to improve staining specificity. Each point in panel D represents results from one mouse. E: Micropipette adhesion assay detects more antigen-specific CD4 islet T cells than tetramer staining. Filled bar shows the percentage of HIP2.5-specific CD4 islet T cells from prediabetic mice detected by micropipette (from panel F) (white bar by tetramer staining [from panel D]). F: Effective 2D affinities for HIP2.5 (open symbols, data pooled from three mice pre- and three mice post-diabetes) and p8G (half-filled symbols, data pooled from two mice pre- and two mice post-diabetes) were calculated for the islet polyclonal CD4 T cells, where lines represent the mean and error bars the SEM and each dot represents an individual cell. Also shown are ChgA29–42 affinities for polyclonal CD4 T cells in the pancreatic lymph node (filled symbols). *P < 0.05, **P < 0.01.

