
Fig. 6. Comparison of α5/TM5/TM6 interactions in M1R-G11 and M2R-GoA complexes.
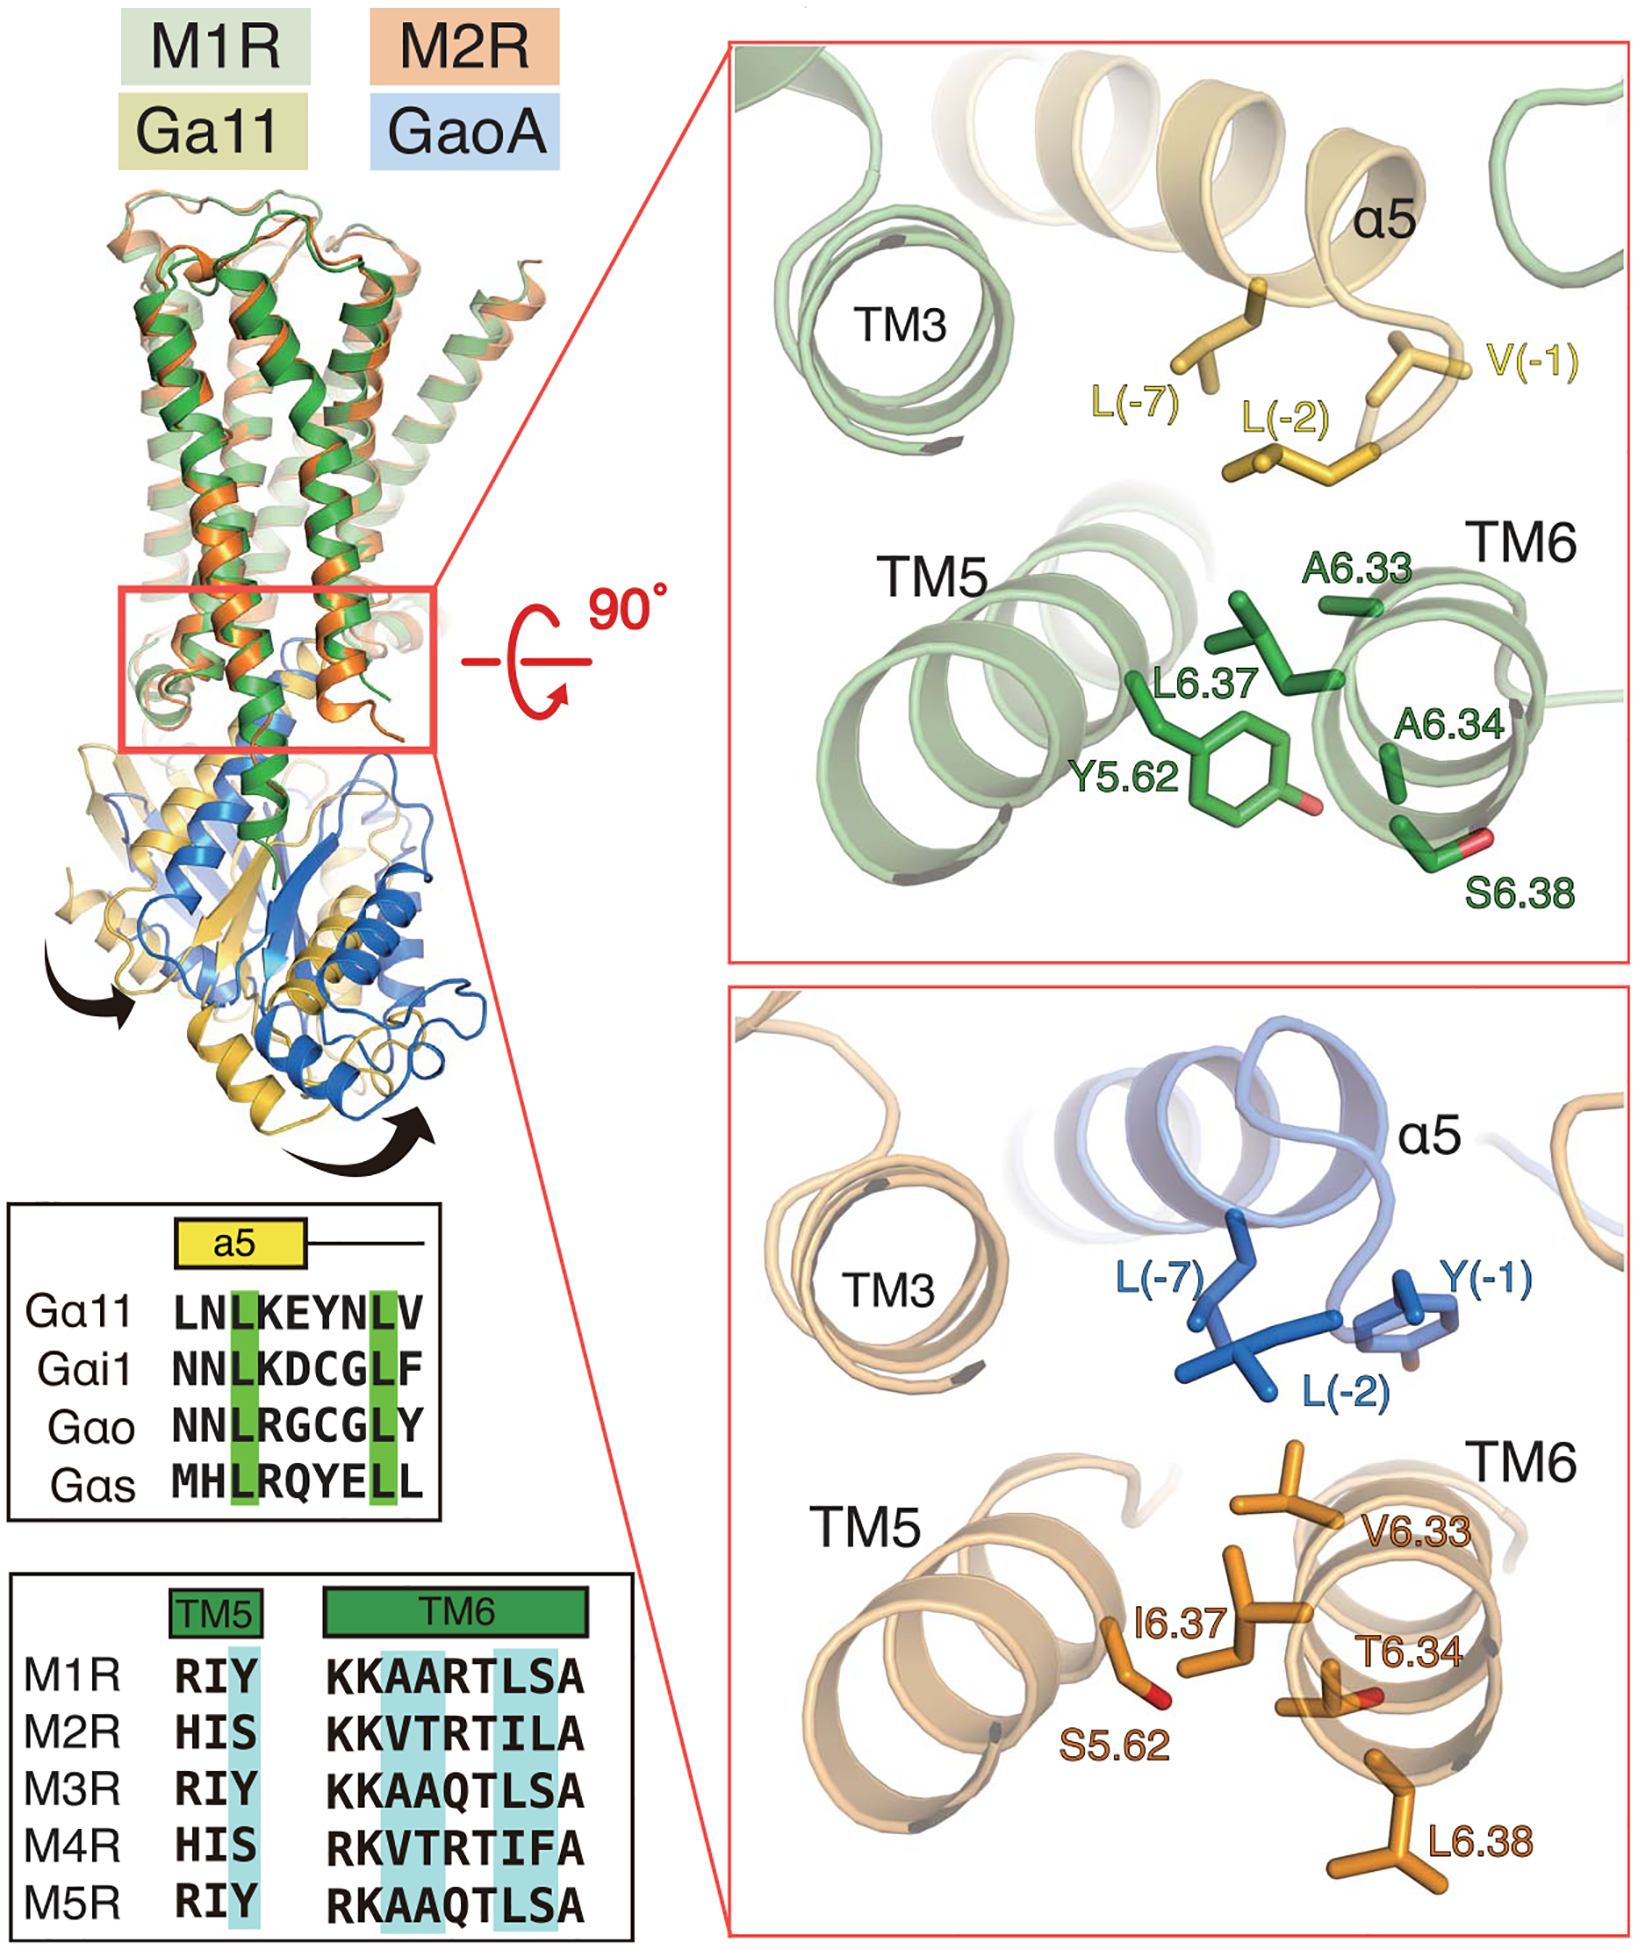
The right panels show a rotated view of the α5/TM5/TM6 interface for M1R-G11 and M2R-GoA complexes indicated in the red box on the left panel. Residues in M1R and M2R that have been indicated by mutagenesis to be important for G-protein coupling specificity are shown as sticks on the receptor structure and are highlighted in blue in the sequence alignments of TM5 and TM6 (lower left).