Figure 5.
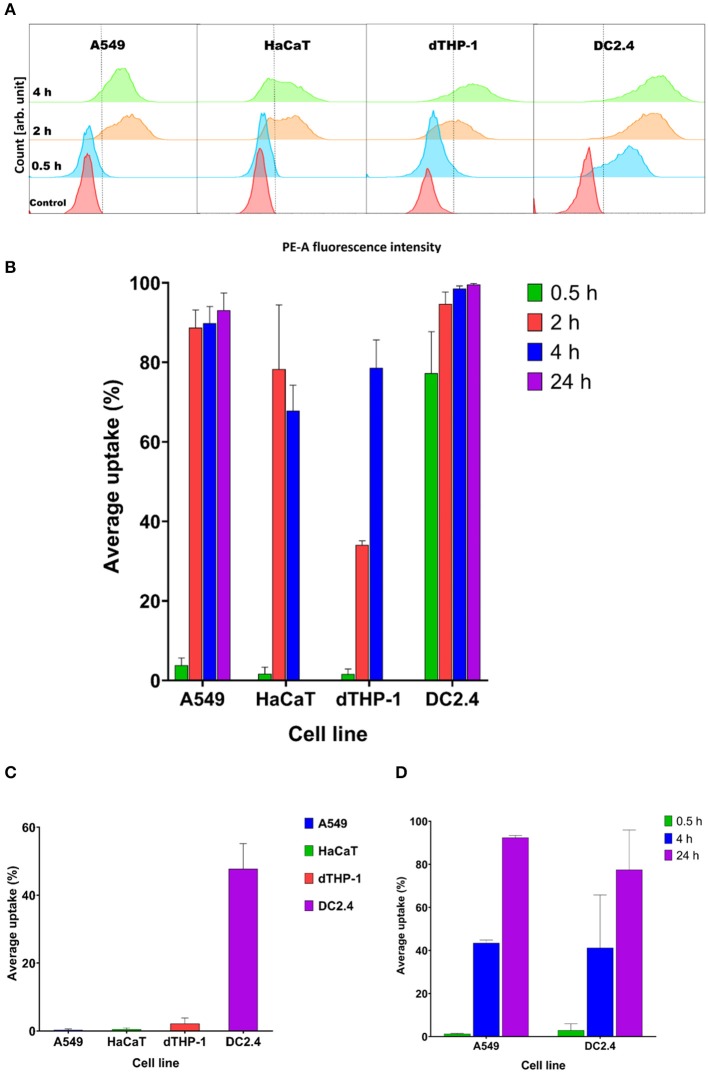
Streptococcal membrane vesicles (MVs) show successful uptake within mammalian cells shown by colocalization during flow cytometry measurement. (A) Phycoerythrin (PE-A) channel fluorescence intensity after incubation of cells with DiI-labeled MVs, with respect to control (PBS-treated) cells. The dashed line separates PE-A channel positive and negative cells. (B) Average percentage uptake of fluorescently labeled MVs inside four mammalian cell lines (A549, HaCaT, dTHP-1, and DC2.4) after different incubation periods (0.5, 2, and 4 h) and uptake of MVs into (A549 and DC2.4) cells after 24-h incubation. (C) Average percentage uptake of fluorescently labeled MVs into four mammalian cell lines (A549, HaCaT, dTHP-1, and DC2.4) after a 4-h incubation period at 4°C. (D) Average percentage uptake of fluorescently labeled liposomes into (A549 and DC2.4) cells after various incubation periods (0.5, 4, 24 h). n = 3, mean ± SD.

