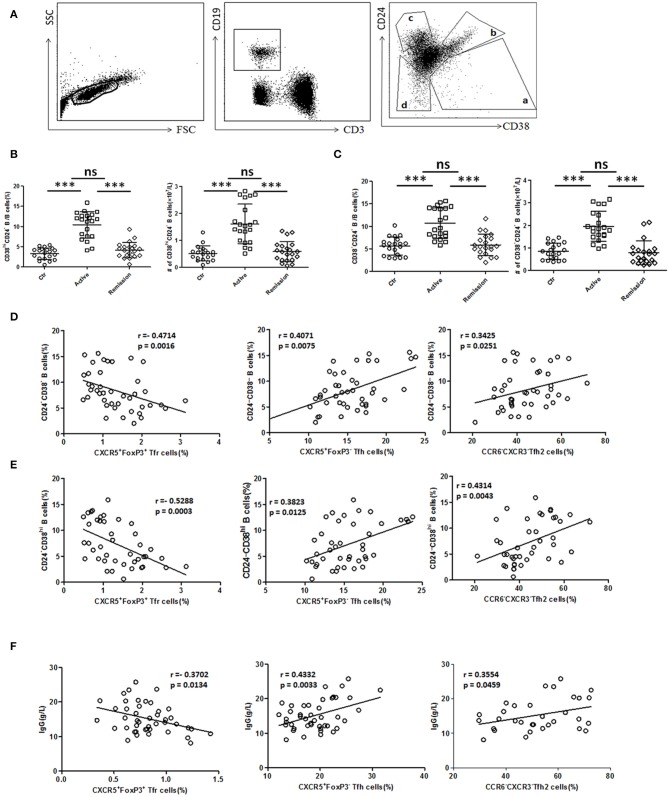
Figure 4.
B cell subset and serum IgG analysis and their relationship with TFR, TFH, and TFH2. (A) Peripheral blood from active UC patients (n = 21), stable remission UC patients (n = 21), and HC (n = 20) were collected. CD24 and CD38 expression classifies circulating B cells into primarily memory B cells (CD19+CD38−CD24high), plasmablasts (CD19+CD38highCD24−), transitional (CD19+CD38highCD24high), and new memory (CD19+CD24−CD38−) B cell subsets, marked sequentially a–d. Representative dot plots for staining for CD19, CD3, CD24, and CD38 was shown. (B,C) Percentages and absolute numbers (per liter) of new memory (d subset) and plasmablasts (a subset) were compared among three groups. Symbols represent individual subjects and bars show the mean ± SD. ***p < 0.001; ns, not significant. (D,E) Correlation analysis between TFR, TFH, TFH2, and new memory B cells or plasmablasts was carried out in all UC patients (n = 42, including 21 active and 21 in stable remission). (F) Serum IgG levels were analyzed and correlation analysis were conducted between IgG and TFR, TFH levels in 44 active UC patients, and between IgG and TFH2 levels in 32 active UC patients. The r-values were the Spearman's correlation coefficients, and p < 0.05 was linearly regressed to show relevant trends.

