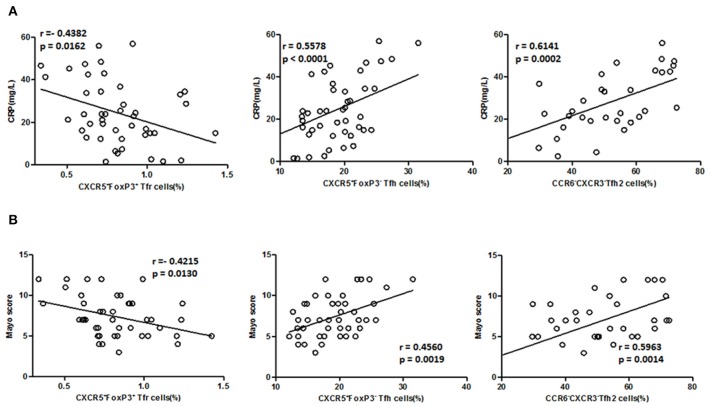
Figure 5.
Correlation between TFR, TFH, TFH2 subsets, and clinical parameters in active UC patients. (A) Levels of CRP in active UC patients were measured, and correlation analysis with percentages of CD4+CXCR5+FoxP3+ TFR cells (n = 44), CD4+CXCR5+FoxP3− TFH cells (n = 44), CXCR3−CCR6− TFH2 subsets (n = 32) were performed. (B) The disease activity of UC was evaluated by Mayo Clinic Score, and correlations with TFR and TFH cells in active UC patients (n = 44), and with percentages of TFH2 cells in active UC patients (n = 32) were performed. The r-values were the Spearman's correlation coefficients, and p < 0.05 was linearly regressed to show relevant trends.

