
Figure 5.
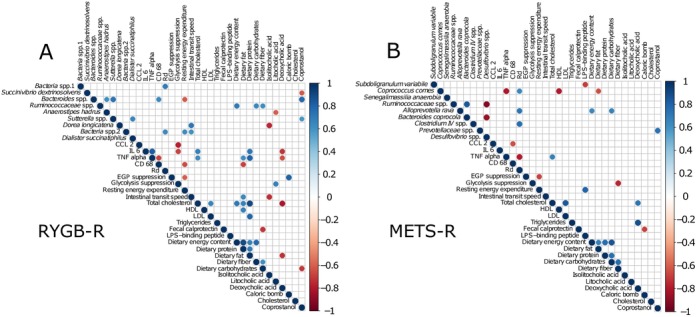
(A and B) Correlation graphs of changes between weeks 0 and 2 in relevant clinical variables and faecal microbiota operational taxonomic unit (OTUs) for both groups. A shows RYGB-R and B shows METS-R. Only significant (Spearman) correlations with p<0.05 are shown. These correlations have not been corrected for false discovery. Colours indicate increase (blue) or decrease (red). CCL2, chemokine ligand 2; CD68, cluster of differentiation 68; EGP suppression, suppression of endogenous glucose production by insulin (hepatic insulin sensitivity); HDL, high-density lipoprotein; IL 6, interleukin 6; LDL, low-density lipoprotein; LPS, lipopolysaccharide; METS-R, metabolic syndrome recipient; Rd, rate of glucose disappearance (peripheral insulin sensitivity); RYGB-R, Roux-en-Y gastric bypass recipient; TNF alpha, tumour necrosis factor alpha.