Figure 6.
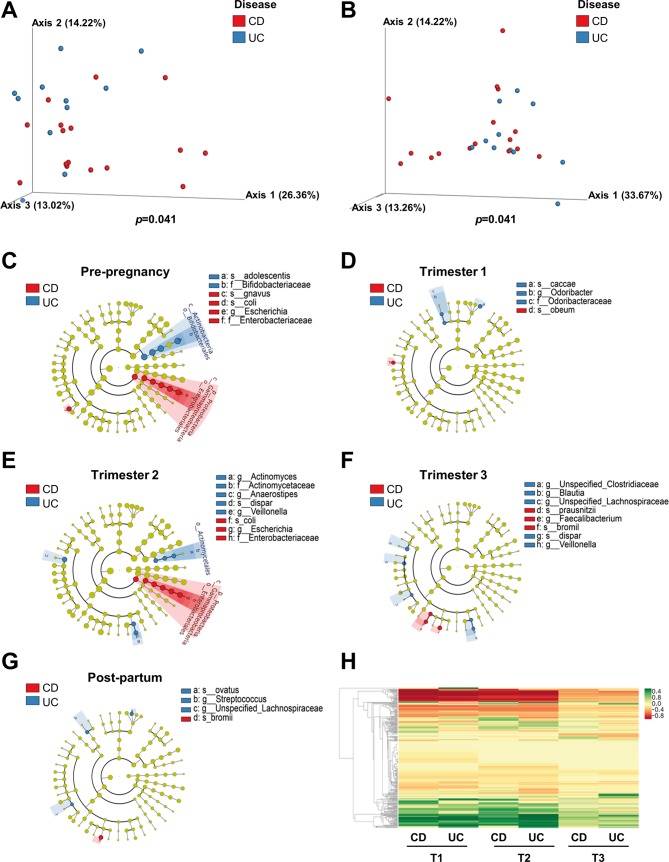
The microbiomes of patients with CD and UC are dominated by different species at each time point. (A and B) β-diversity using principal coordinate analysis of unweighted (A) and weighted (B) UniFrac distances (p=0.041) of prepregnancy samples (CD n=16, UC n=11). (C–G) Cladogram of significant differentially abundant microbial taxa obtained using LEfSe of prepregnancy (C), first (CD n=19, UC n=8) (D), second (CD n=16, UC n=5) (E), third (CD n=25, UC n=11) (F) trimester and postpartum (CD n=13, UC n=6) (G) gut microbiomes. (H) Spectral clustering of bacteria based on the difference between the UC and CD and over all trimesters. CD, Crohn’s disease; LEfSe, linear discriminant analysis effect size.

