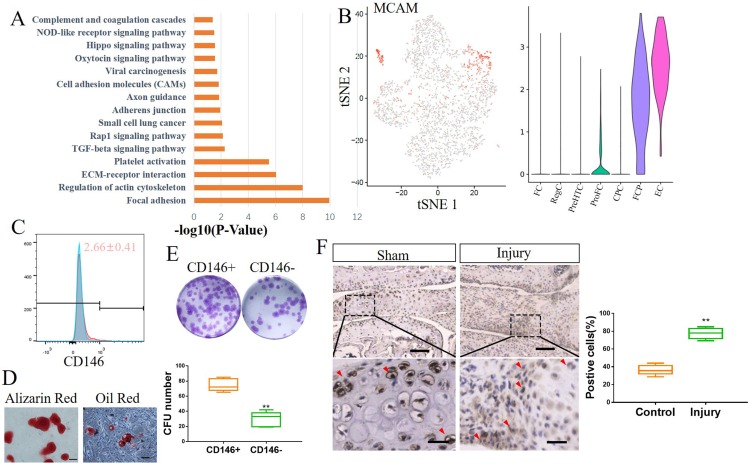
Figure 2.
Identification of human meniscus progenitor cells. (A) The 15 most upregulated signal pathways in FCP. (B) Dot plots showing the MCAM expression on t-distributed stochastic neighbour embedding (t-SNE) map and Vin plot. (C) CD146 expression in healthy human meniscus cells determined by flow cytometry (mean±SD; n=3). (D) Alizarin red staining and oil red staining for CD146+ meniscus cells induced to osteogenic differentiation or adipogenic differentiation, respectively (n=5). Scale bar, 50 µm. (E) Colony-forming analysis of CD146+ and CD146− healthy human meniscus cells and quantification. n=5, **p<0.01. (F) IHC staining of MYLK in mice meniscus injury model, and quantification of positive cells. Scale bars, 200 µm (top) and 50 µm (bottom). n≥6, **p<0.01. CFU colony forming unit; CPC, cartilage progenitor cells; EC, endothelial cells; FC, fibrochondrocytes; FCP, fibrochondrocyte progenitors; NOD, nucleotide-binding oligomerisation domain; PreHTC, prehypertrophic chondrocytes; ProFC, proliferate fibrochondrocytes; RegC, regulatory chondrocytes.

