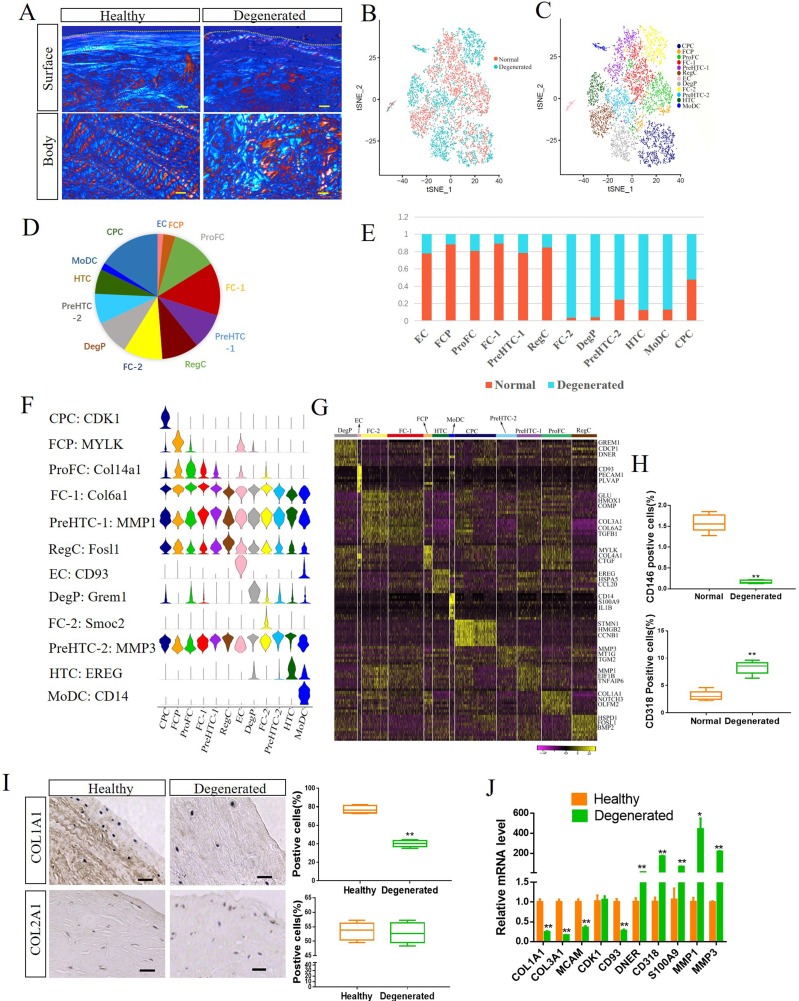
Figure 4.
Comparison of the single cell landscape between healthy human meniscus and degenerated meniscus. (A) Representative polarised light microscopy images of healthy human and degenerated meniscus. The white and red colours in the angle images are 90° apart in orientation. Dashed lines indicate the surface of the meniscus. Scale bar, 100 µm. (B) Merged t-distributed stochastic neighbour embedding (t-SNE) of single-cell RNA sequencing of healthy meniscus cells and degenerated meniscus cells. (C) Twelve healthy human and degenerated meniscus cell clusters at t-SNE. (D) Proportion of each cluster to the total cells. (E) Proportion of healthy and degenerated meniscus cells in each cluster. (F) Expression of representative marker genes in Vin plot. (G) Heatmap revealing the scaled expression of differentially expressed genes for each cluster. (H) CD146 and CD318 expression in healthy human meniscus cells and degenerated meniscus cells determined by flow cytometry. n≥5, **p<0.01. (I) Representative IHC staining of COL1A1 and COL2A1 healthy human meniscus and degenerated meniscus, and quantification of positive cells. Scale bar, 50 µm. n≥5, **p<0.01. (J) The expression of indicated marker genes in human healthy meniscus cells and degenerated meniscus cells were detected by qRT-PCR. *p<0.05, **p<0.01, otherwise, not significant. n=3, *p<0.05, **p<0.01. CPC, cartilage progenitor cells; DegP, degenerated meniscus progenitor cells; EC, endothelial cells; FC, fibrochondrocytes; FCP, fibrochondrocyte progenitors; HTC, hypertrophic chondrocytes; MoDC, monocyte-derived dendritic cells; PreHTC, prehypertrophic chondrocytes; ProFC, proliferate fibrochondrocytes; RegC, regulatory chondrocytes.

