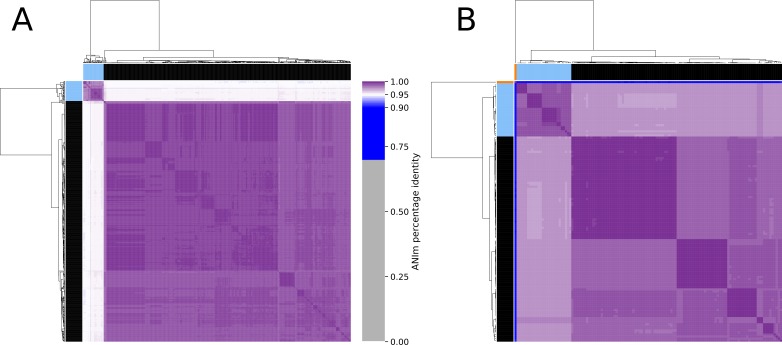
Figure 4. Clustered heatmap of ANIm percentage identity for (A) 575 Enterococcus faecium and (B) 129 Pediococcus acidilactici genome assemblies.
Purple colored cells in the heatmap correspond to ANIm percentage identity above 95%, color intensity fades towards the proposed species threshold cutoff. Blue colored cells are below this threshold indicating that the corresponding genome assembly does not belong to the same species. Color bars on top and on the left of the heatmap correspond to the clusters and the colors indicated in the phylogenetic trees (Figs. 2 and 3). Dendograms are based on single-linkage hierarchical clustering of the ANIm percentage identities. Row and column names can be found in Dataset S3.

