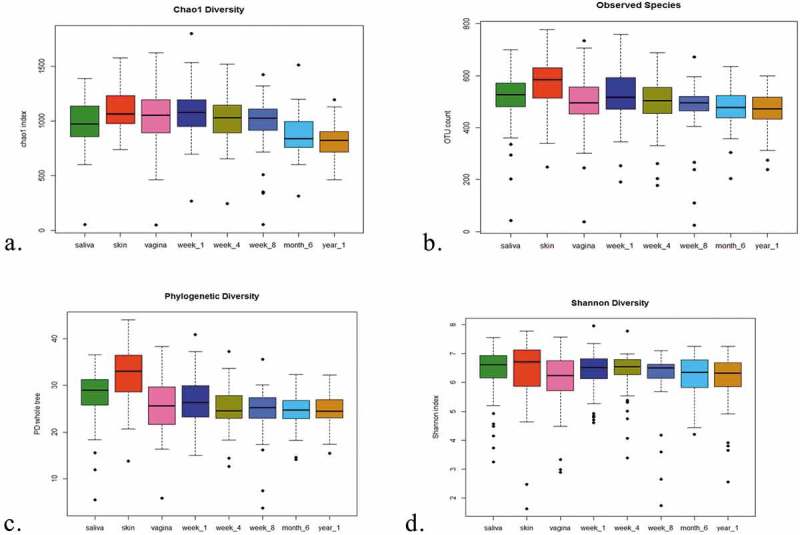
Figure 4.

Alpha-diversity comparisons of the eight subject groups [(1) mother saliva, (2) Skin (mother) and (3) vagina (mother) and (4–8) infant oral weeks 1, 4, 8, 6 months and 1 year]. (a) Boxplot of chao1 diversity in the three groups, (b) boxplot of observed species in the eight groups, (c) boxplot of PD in the eight groups and (d) boxplot of Shannon diversity in the eight groups. Outliers are represented by black points.
