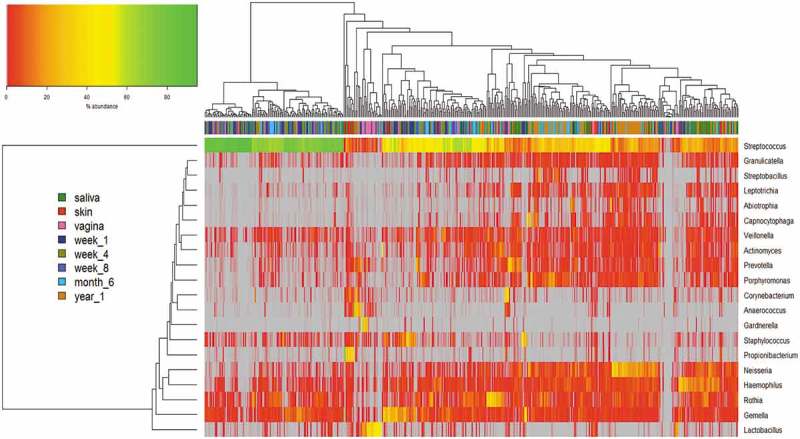
Figure 5.

Hierarchical clustering of microbiota data at genus level. Abundances are colour-coded according to the colour key on the top left with grey representing a value of zero. Euclidean distance and complete linkage were used to cluster the rows and columns of the heatmap. The colour bar on side of the heatmap corresponds to sample type. Each genus with a mean ≥0.5% across all samples was included. All taxa present at less than 1% in all groups are excluded from the heatmap.
