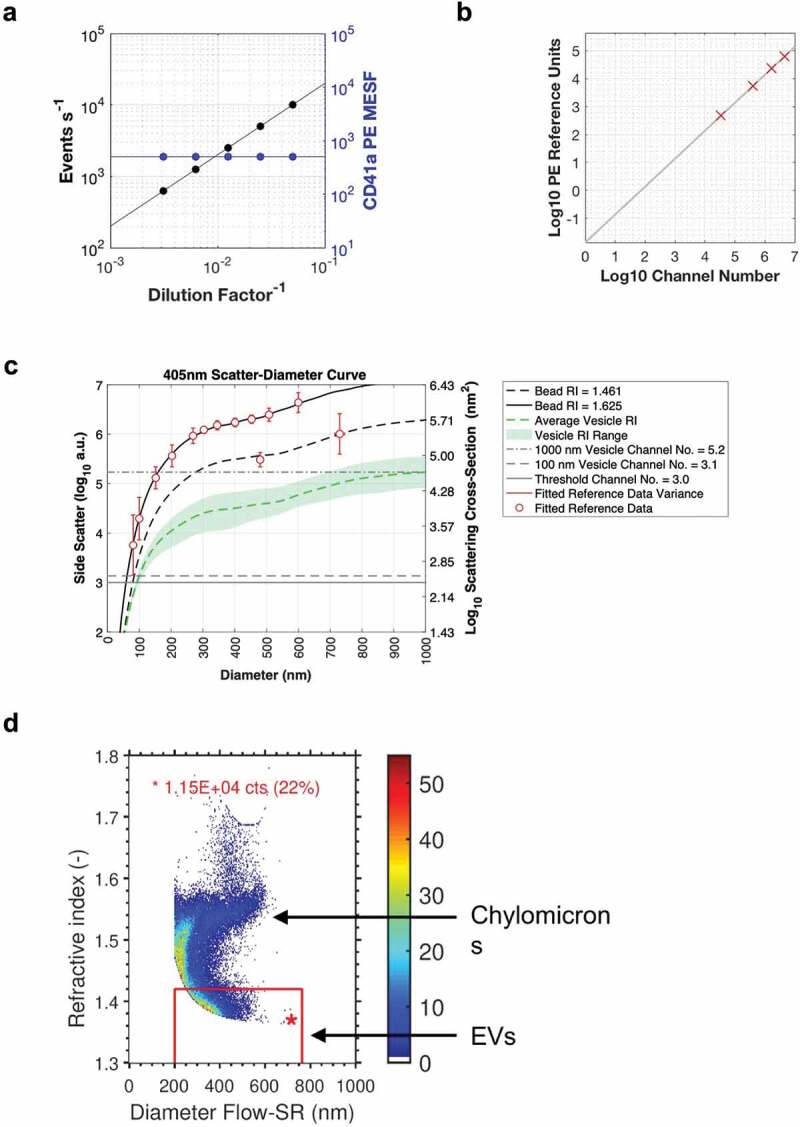
Figure 3.

(a) Example plot of reporting serial dilutions data, with event count per second on the left y-axis, median PE MESF intensity of the recorded data on the right y-axis and the dilution factor on the x-axis. (b) Example plot of reporting fluorescence calibration using regression. The fluorescent intensity in arbitrary units (channel number) is on the x-axis with the related fluorescence population reference units on the y-axis. (c) Example plot of light scatter calibration at 405 nm using FCMPASS software default values. (d) Example plot of refractive index and diameter determination using Flow-SR. methodology.
