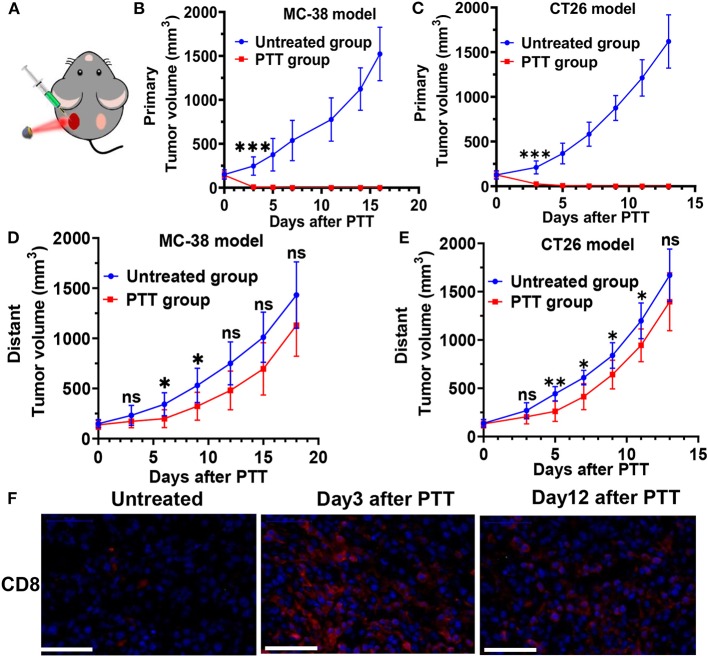
Figure 3.
(A) Schematic illustration of ICG-liposome-based PTT on mice. Primary tumor growth profile of MC-38-bearing (B) and CT26-bearing (C) mice from each group. Distant tumor outgrowth curves of double MC-38 tumor-bearing mice (D) and double CT-26 tumor-bearing mice (E) in which the primary tumor was left untreated or PTT-treated. (F) CD8 T cells infiltration of each group in the MC-38 tumor microenvironment on day 3 and 12 after treatment was examined by immunofluorescence. n = 6 in each group. Data are presented as means ± SD. Statistical significance was calculated by Student's t-test: ***P < 0.001, **P < 0.01, *P < 0.05.

