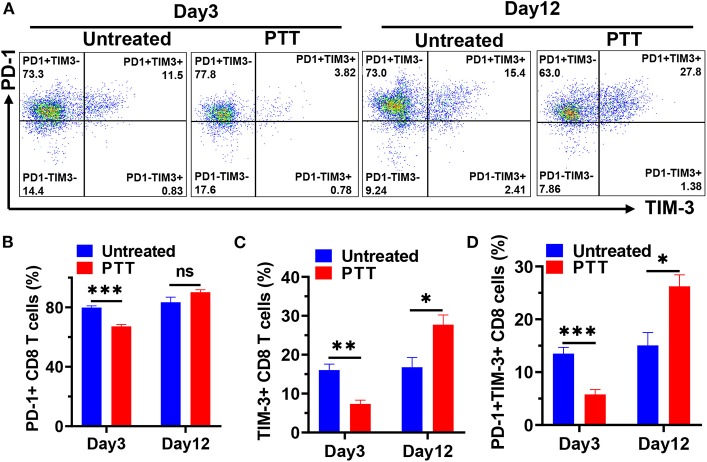
Figure 5.
(A) Representative flow cytometric plots showing PD-1 and TIM-3 expression in tumor-infiltrating CD8 T cells on days 3 and 12 after PTT. Flow cytometry results showing the percentage of PD-1+ (B), TIM-3+ (C), and PD-1+TIM-3+ (D) CD8 T cells on days 3 and 12. n = 5 in each group. Data are presented as means ± SEM. Statistical significance was calculated by Student's t-test: ***P < 0.001, **P < 0.01, *P < 0.05.

