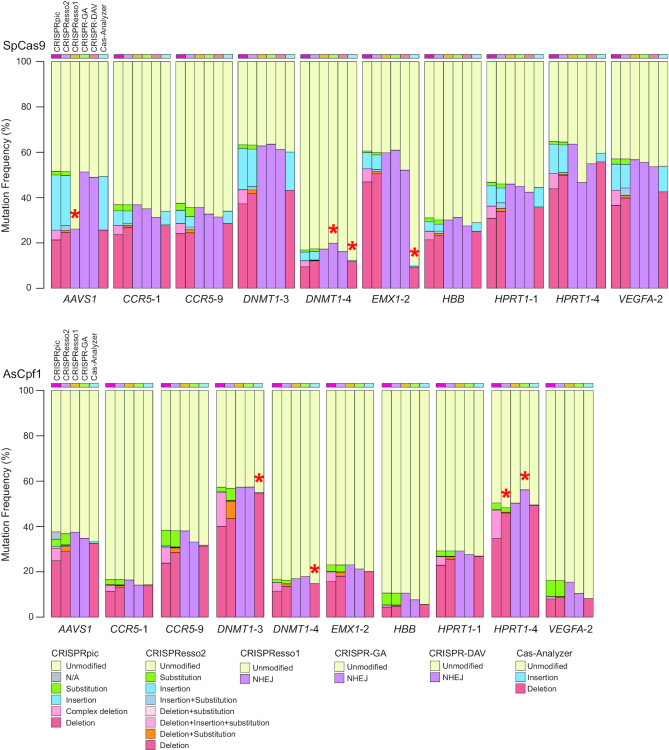
Figure 4.
Comparison of analysis by different programs for CRISPR-induced mutations. Mutation frequencies analyzed by CRISPRpic in addition to other programs for 10 different target loci treated by SpCas9 (upper) or AsCpf1 (lower). Red asterisks indicate outliers located 1.5 times outside the interquartile range above the upper quartile and below the lower quartile.

