Figure 5.
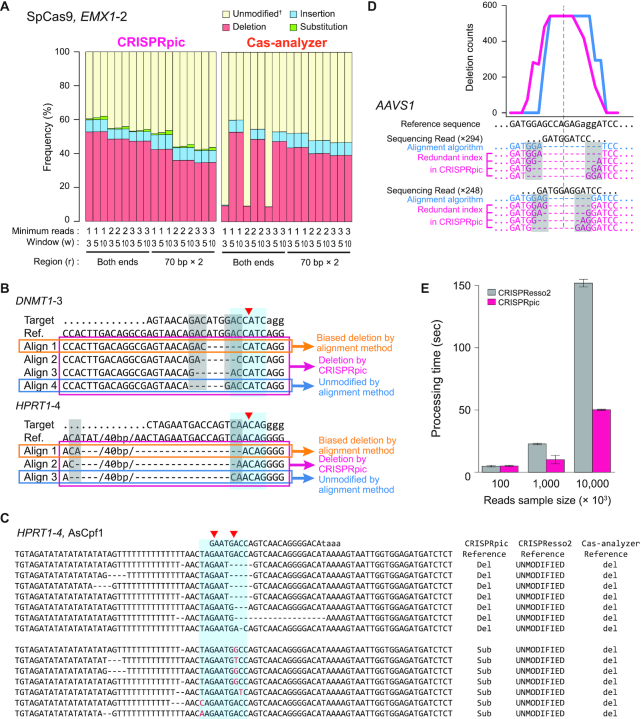
Non-alignment algorithm of CRISPRpic provides precise analysis of CRISPR-induced mutations (A) Comparison of mutation frequencies for EMX1-2 locus by different parameters of CRISPRpic or Cas-Analyzer. †Cas-analyzer does not distinguish substitutions from unmodified alleles. (B) Example of classification of deletions harboring micro-homology sequences. Blue or gray box indicates mutagenic window (±3 bp from breakpoint, red triangle) or micro-homology sequences, respectively. (C) Example of erroneous mutation calling by alignment method. (D) Unbiased analysis of deletion pattern by CRISPRpic. Two sequencing reads from the AAVS1 locus were extracted from actual output files of CRISPRpic or CRISPResso as an example. Micro-homology sequences are marked in the gray box. Pink or blue line indicates deletion distribution for each nucleotide position analyzed by CRISPRpic or CRISPResso, respectively. Dashed line indicates the breakpoint. (E) Bar plots showing processing time for analysis of the PVT1 locus using CRISPRpic or CRISPResso2.

