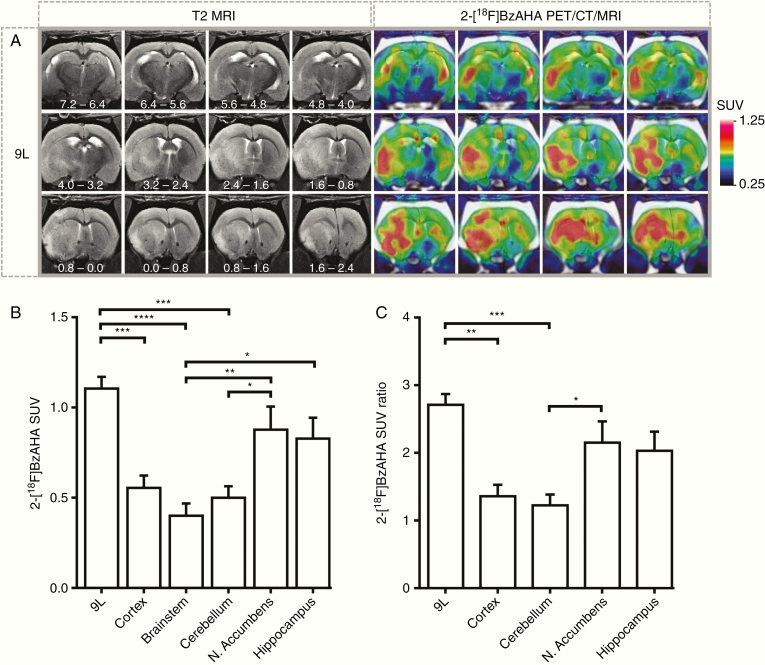
Fig. 1.
PET/CT/MRI of SIRT1 expression–activity in 9L intracerebral gliomas in rats. (A) Representative series of coronal images of the rat brain bearing intracerebral 9L glioma. The position of sections relative to bregma is indicated in millimeters on T2-weighted MR images. 2-[18F]BzAHA PET/CT images were obtained at 20 min post-injection of radiotracer and co-registered with T2-weighted MR images. The levels of 2-[18F]BzAHA accumulation in tumors and different structures of the brain were measured in standard uptake value (SUV). (B) SUV for 9L gliomas (N = 6) as compared to other structures within the brain. (C) SUV ratio normalized by the SUV of the brainstem region for 9L gliomas. PET/CT images are color coded to SUV. Data—mean ± SEM. Statistical significance was determined via one-way ANOVA, *P < .05, **P < .01, ***P < .001, ****P < .0001.

