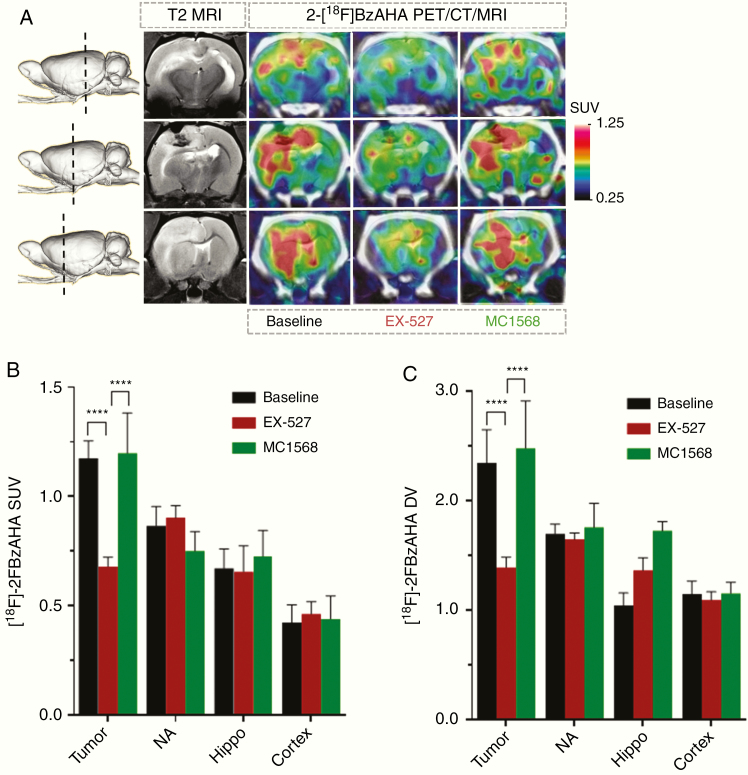
Fig. 3.
Monitoring pharmacologic inhibition of SIRT1 with 2-[18F]BzAHA PET/CT/MRI. (A) Representative coronal T2-weighted MRI and 2-[18F]BzAHA PET/CT/MR images depicting different regions of the rat brain with intracerebral 9L tumor (shown by a dotted line on a side-view of a 3D rendered image): through the area of the hippocampus (Hippo, top), 9L tumor (9L, middle), nucleus accumbens (NA, bottom). 2-[18F]BzAHA PET/CT images were obtained at 20 min post-radiotracer administration before (baseline) and after treatment with either EX-527 (SIRT1 selective inhibitor) or MC1568 (HDAC class IIa selective inhibitor). PET/CT images are color-coded to standard uptake values (SUVs). The levels of 2-[18F]BzAHA-derived radioactivity are expressed as (B) SUVs or (C) distribution volumes (DVs) in 9L tumors and different brain structures at baseline (N = 4) and after therapy with EX-527 (N = 3) or MC1568 (N = 3). Data—mean ± SEM. Statistical significance was determined using ANOVA for repeated measures; ****P < .0001.

