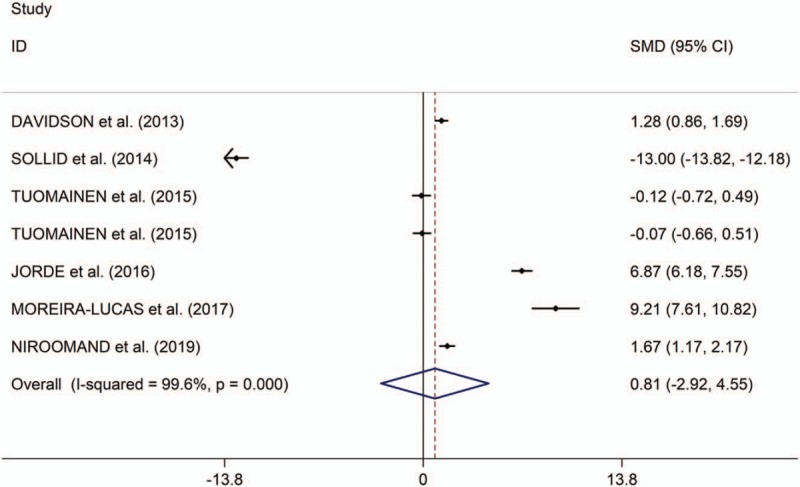
Figure 5.

Forest plots of changes of HOMA-IR comparing groups (individuals with prediabetes given vitamin D and those given placebo). HOMA-IR indicates homeostatic model assessment of insulin resistance.

Forest plots of changes of HOMA-IR comparing groups (individuals with prediabetes given vitamin D and those given placebo). HOMA-IR indicates homeostatic model assessment of insulin resistance.