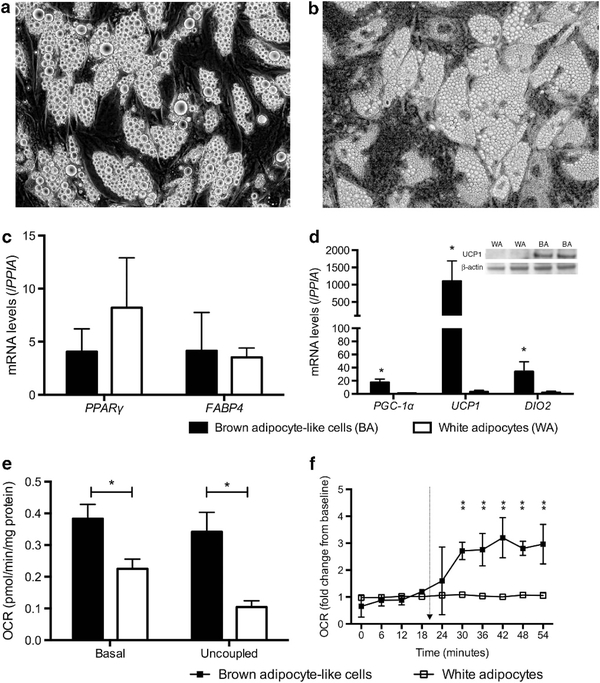
Figure 4.
Comparison between beige (i.e. BA-like cells) and WAs. (a) Differentiated WAs (40 x) displayed similar morphology as (b) beige adipocytes (40 x), other than slightly larger lipid droplets. (c) Expression of general adipogenic genes was not different between beige and WAs, whereas (d) traditional brown fat gene expression was significantly higher in the former (N = 7). UCP1 protein was present in beige but not WAs. (e) Basal OCR and respiratory uncoupling were significantly lower in WAs (N = 6). (f) WAs did not respond to norepinephrine and no thermogenic response was detectable (N = 5). *P<0.01. Arrow indicates norepinephrine injection.

