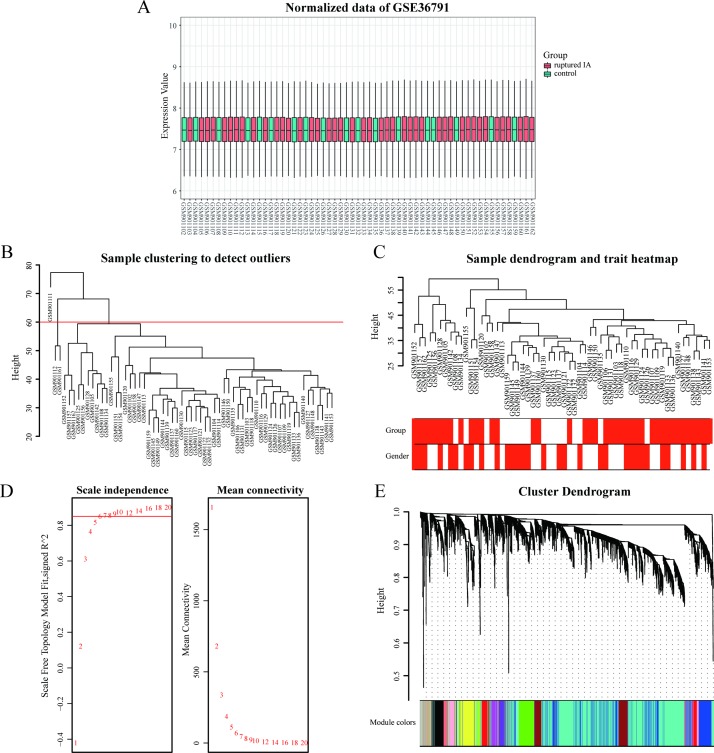
Fig 2. Expression analysis of the GSE36791 dataset.
(A) Reliability of the data is shown with a box plot of the normalized data of GSE36791. (B) Sample clustering was performed to detect outliers. Three samples were excluded in this study (GSM901111, GSM901112, and GSM901161). (C) A clustering dendrogram of 58 samples and their associated clinical traits was generated based on gene expression. Color intensity is proportional to group (i.e., ruptured IA/reference groups) and gender. (D) The left and right panels show analyses of the scale-free fit index and mean connectivity for various soft-thresholding powers (β), respectively. (E) Modules associated with clinical information were identified and labeled with different colors.

