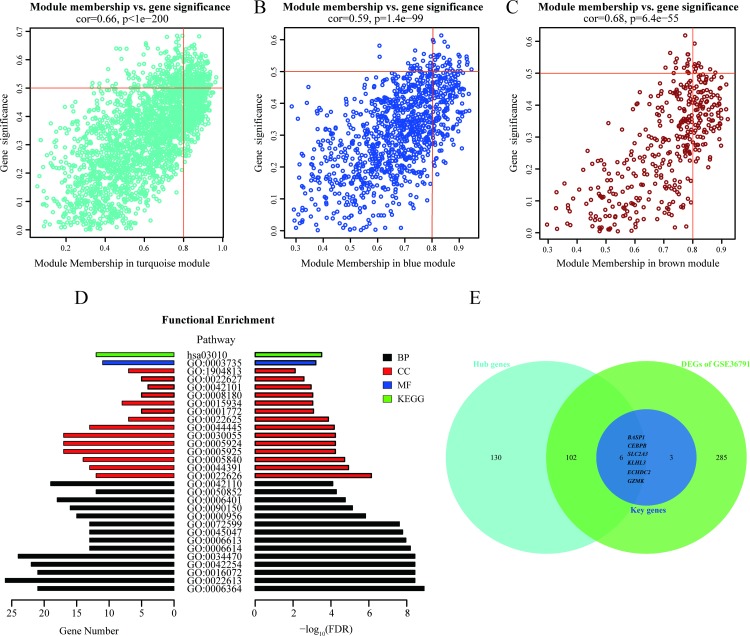
Fig 4. Detection and functional analysis of hub genes.
Scatterplots were generated to depict correlations between module membership and gene significance values for the turquoise (A), blue (B), and brown (C) modules. Highly significant correlations were observed between gene significance and module membership in each of these three modules. (D) GO and KEGG annotations of the hub genes were performed. GO terms and KEGG pathways with threshold values of FDR < 0.05 were considered significant and are labeled as follows: BP (biological process) in black; CC (cellular component) in red; MF (molecular function) in blue; and KEGG (Kyoto Encyclopedia of Genes and Genomes) in green. (E) A Venn diagram displays the six common genes among the hub genes, key genes, and DEGs. Thus, these six genes are considered candidate biomarkers.

