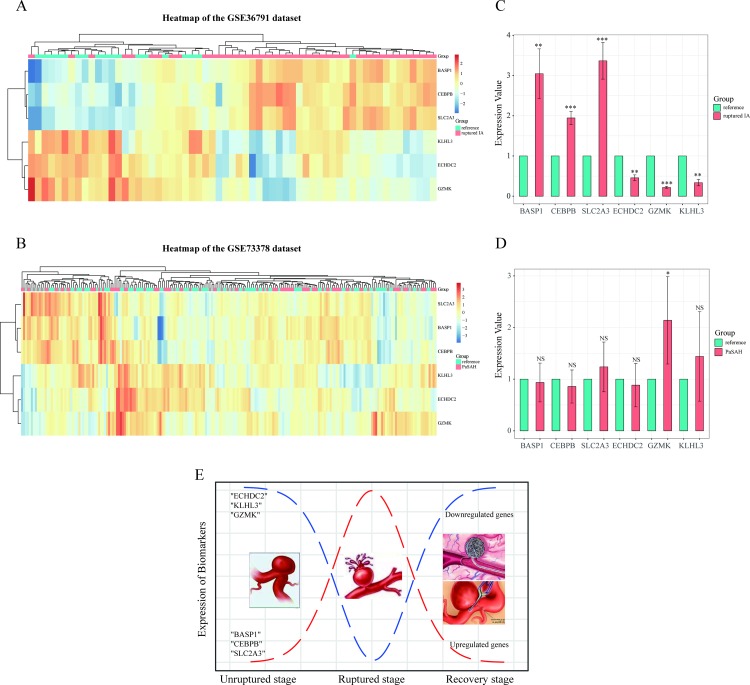
Fig 5.
Heat maps show the expression profiles of the six candidate biomarker genes in the GSE36791 (A) and GSE73378 (B) datasets. Orange and blue coloring indicates high and low expression values, respectively. In the GSE36791 dataset, there is a mixture of ruptured aneurysm samples in the reference group. However, a good cluster was still obtained for the ruptured IA group compared to the GSE73378 dataset. (C, D) Validation of gene expression levels for BASP1, CEBPB, SLC2A3, ECHDC2, GZMK, and KLHL3 in ruptured IA (or PaSAH) and reference samples. Data are presented as 2-ΔΔCT relative to GAPDH. *P < 0.05, **P < 0.01, ***P < 0.001, NS: not significant. (E) A representation of the biological events which occur during IA rupture through recovery, with gene regulation of the six relevant genes identified in the present study shown as well.

