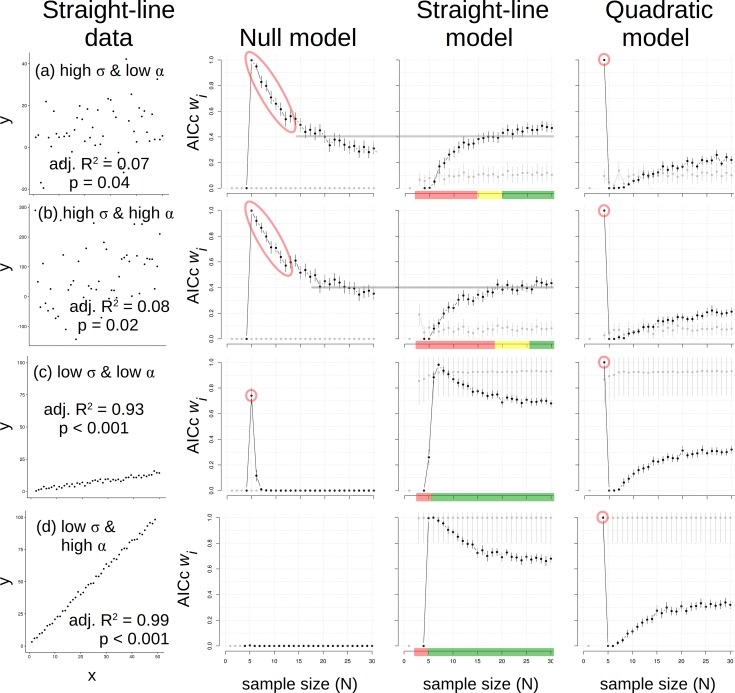
Fig 3. Data made with a straight-line model (1st column) and results of analyses using null (2nd column), straight-line (3rd column) and quadratic (4th column) models.
The four combinations (a-d) of low/high variance (σ) and effect size (α) represent approximate graphical extremes. Grey lines represent transitions in leading wi between two models. “Traffic signal” colors on sample size (N) axes for the straight-line model indicate ranges where N is too small (red = stop), about equivalent to the null (yellow = caution), or sufficient (green = go) to correctly infer the pattern. Note the null and quadratic model outcomes at low N (red circles or ellipses).

