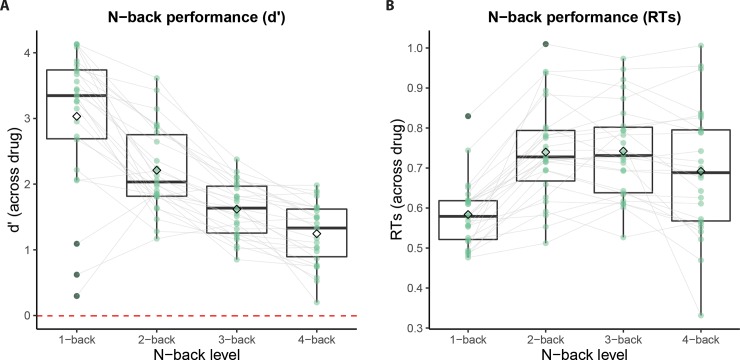
Fig 3. Performance on the N-back task as a function of working memory load (i.e. levels) across drug.
A d′, the estimate of participants’ sensitivity to targets corrected for the propensity to make a target response (false alarms), decreased as a function of N-back levels. B Response times increased as a function of N-back level, but showed an inverted U-shape, in line with earlier report using this task [16]. In both graphs, the horizontal lines in the boxplots represent the median, the diamond represents the mean and green dots are the mean per subject. Average d’ measures contain outliers in level 1 (see dots with gray edge) because on one of the testing days these participants initially swapped keys for target vs. non-target (only in level 1) and had negative d’ for one session.

