
Fig 2. Average and individual lumbar IVD Pfirrmann grades.
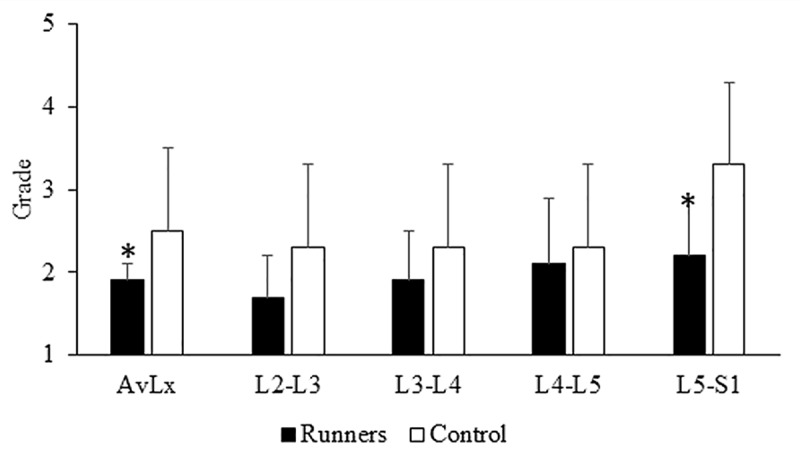
*P<0.05 when compared to control Average Pfirrmann grades for the whole lumbar spine and the L5/S1 segment were approximately half a grade significantly lower in runners compared to controls.