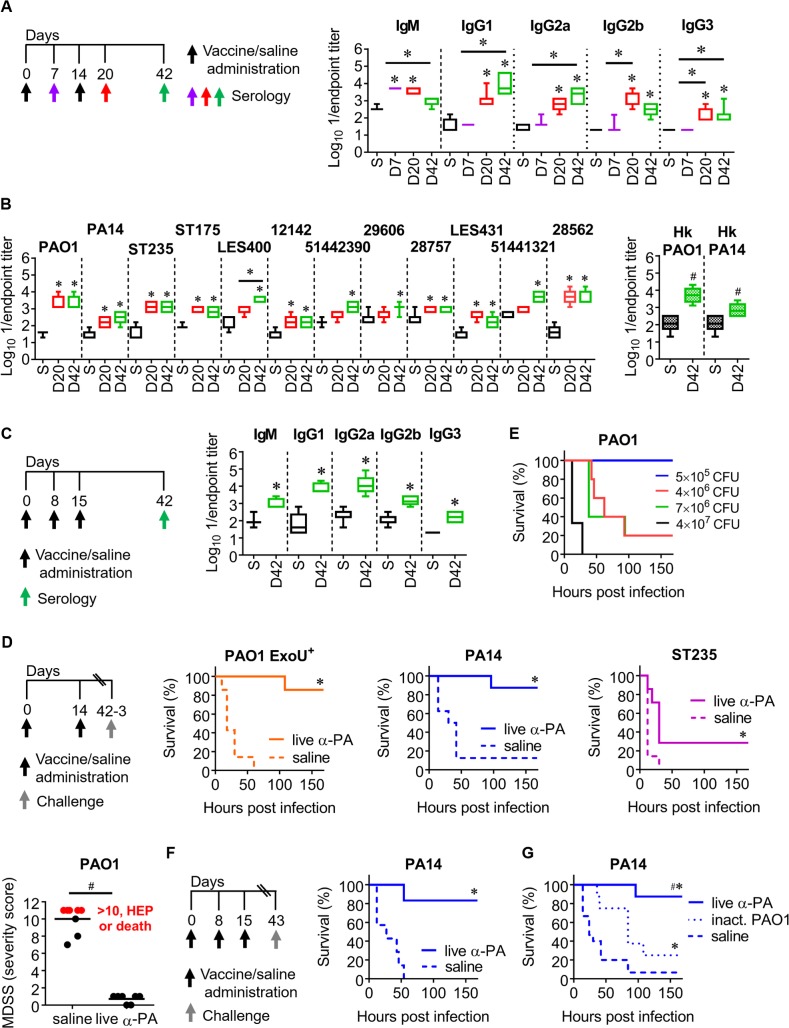
Fig 1. α-PA vaccine generates cross-reactive antibodies and heterogeneous protection against PA-pneumonia.
(A) Immunization schedule and antibody titers against PAO1 in vaccinated (n = 7) and control (n = 7) mice after one or two IN immunizations with α-PA vaccine (2×10⁸ CFU), or saline administration, respectively. (B) IgG titers against different live and Hk PA strains in vaccinated (n = 6–7) and control (n = 5–7) mice after two IN immunizations with α-PA vaccine (2×10⁸ CFU), or saline administration, respectively. (C) Immunization schedule and antibody titers against PAO1 in vaccinated (n = 5) and control (n = 6–7) mice after three IN immunizations with α-PA vaccine (2×10⁸ CFU), or saline administration, respectively. (A-C) S, saline; D, day. (A, B) *P<0.05 (Kruskal-Wallis test), compared with saline and between the indicated groups. (B) #P<0.05 (Mann-Whitney U test), compared with saline group. (C) *P<0.05 (Mann-Whitney U test), compared with saline group. (D) Immunization schedule, mice survival and assessment of murine disease severity score (MDSS) after IN administration of α-PA vaccine (2×10⁸ CFU), or saline and IN challenge with PAO1 ExoU+ (7×10⁵ CFU, n = 7), PA14 (1×10⁶ CFU, n = 8), ST235 (3×10⁷ CFU, n = 7) and PAO1 (2×10⁶ CFU, n = 7–8). (E) Mice survival after IN challenge with different doses of PAO1 (n = 3–5 mice/group). (F) Immunization schedule and mice survival after IN administration of α-PA vaccine (2×10⁸ CFU, n = 6), or saline (n = 7) and IN challenge with PA14 (1×10⁶ CFU). (G) Mice survival after IN immunization with α-PA vaccine (2×10⁸ CFU, n = 8), inactivated PAO1 (2×10⁸ CFU, n = 8) or saline administration (n = 15) and IN challenge with PA14 (1×10⁶ CFU), according to schedule (D). (D, F and G) *P<0.05 (log-rank test), compared with saline group. (D) #P<0.05 (Mann-Whitney U test). (G) #P<0.05 (log-rank test), compared with mice administered inactivated PAO1.

