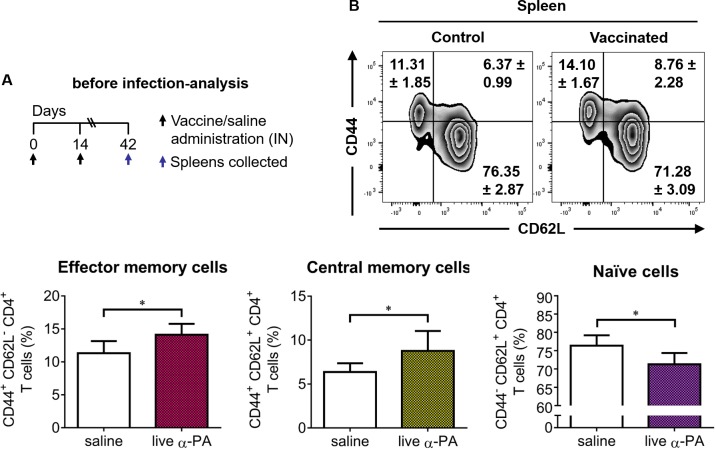
Fig 2. Production of memory CD4+ T cells in vaccinated mice.
(A) Mice (n = 6/group) were immunized with α-PA vaccine (2×10⁸ CFU) or administered saline, according to the schedule; then spleens were collected. (B) Percentage of spleen effector memory (CD44+ CD62L-), central memory (CD44+ CD62L+) and naïve (CD44- CD62L+) CD4+ T cells. Contour plots correspond to a representative example of CD4-gated T cells of the analyzed samples. Analysis regions were set according to FMO and isotype control-stained samples. Numbers inside plot regions represent means ± SD of the frequency of cells due to respective cell staining. Bars represent mean ± SD of data. *P<0.05 (t-test).

