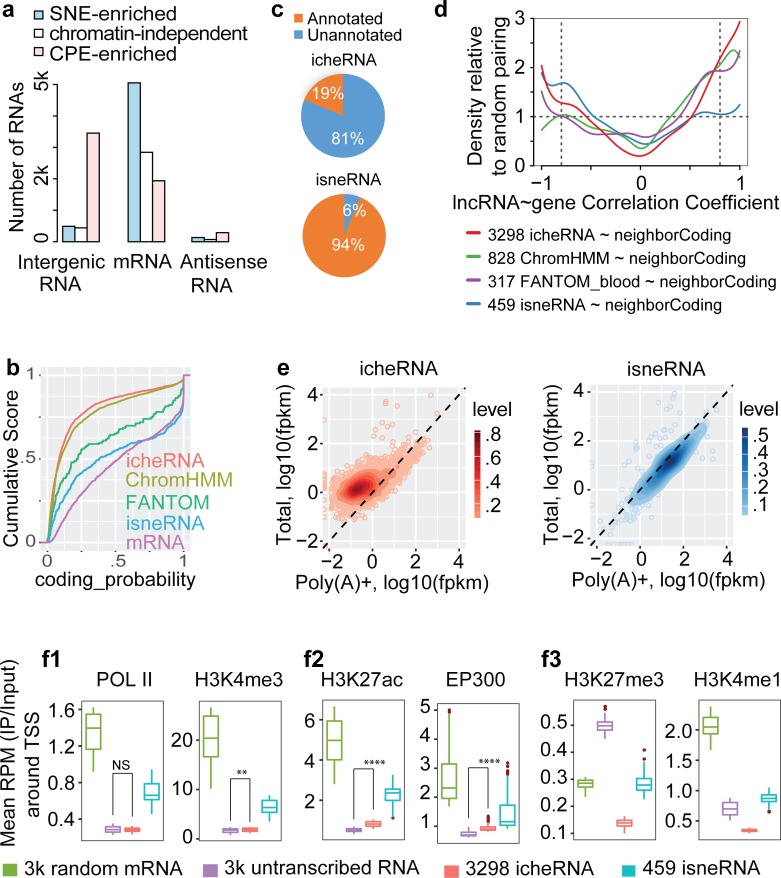
Fig 4. Known genomic features of the icheRNA in the K562 nucleus.
a, Distribution of three classes of expressed RNA (CPM>1) in fractionated libraries. Three classes were defined based on their relative genomic locations to GENCODE (v25)-annotated coding genes (S3 Fig). Chromatin-independent RNAs refer to RNAs not differentially expressed in CPE and SNE samples. b, Coding potential of icheRNA (red), ChromHMM-predicted intergenic eRNAs (yellow), FANTOM5-predicted eRNAs (green, of which the majority overlap with coding genes), isneRNA (blue) and mRNAs (purple). Intergenic RNA overlapped (at least 1 base) with any ChromHMM/FANTOM5 identified enhancer region is assumed to be predicted ChromHMM/FANTOM5 predicted eRNAs. The online tool CPC2 is used. c, Percentage of GENCODE (v25) annotated and unannotated RNAs in icheRNA and isneRNA. d, Pairwise Correlation of expression between RNAs in four classes and their local genes. To pair an intergenic genomic feature with its neighboring gene, the adjacent upstream or downstream gene with the highest magnitude PCC is selected. The relative density at a certain PCC value is calculated by dividing the kernel density estimates of indicated RNA and neighboring-gene pairs by its own random control. For example, the random control of the 3,298 icheRNA-neighboring gene pairs is that of pairing these icheRNA with randomly selected coding genes (S4 Fig, dash line). Two vertical dashed lines mark significant cutoffs of PCC values at -0.8 or 0.8. e, Normalized expression values of fractionate RNA classes. Values are given in FPKM in Poly(A)+ nuclear RNA-Seq library (x-axis, GSE88339) versus nuclear total-RNA-Seq library (y-axis, GSE87982). f, Average ChIP-seq read density versus input centered at promoters (±1kb centered at TSS) of RNAs, p-values calculated by two-sided Wilcoxon rank sum test, NS p>0.05, * p<0.01, ** p<1e-10, **** p<2.2e-16. (Note that in each panel, boxes without overlaps are significantly different without showing **** for simplicity.) 3k random mRNAs were selected from 9.8k transcribed mRNAs and 3k randomly selected silent RNAs from 66.9k annotated but K562-untranscribed RNAs.

