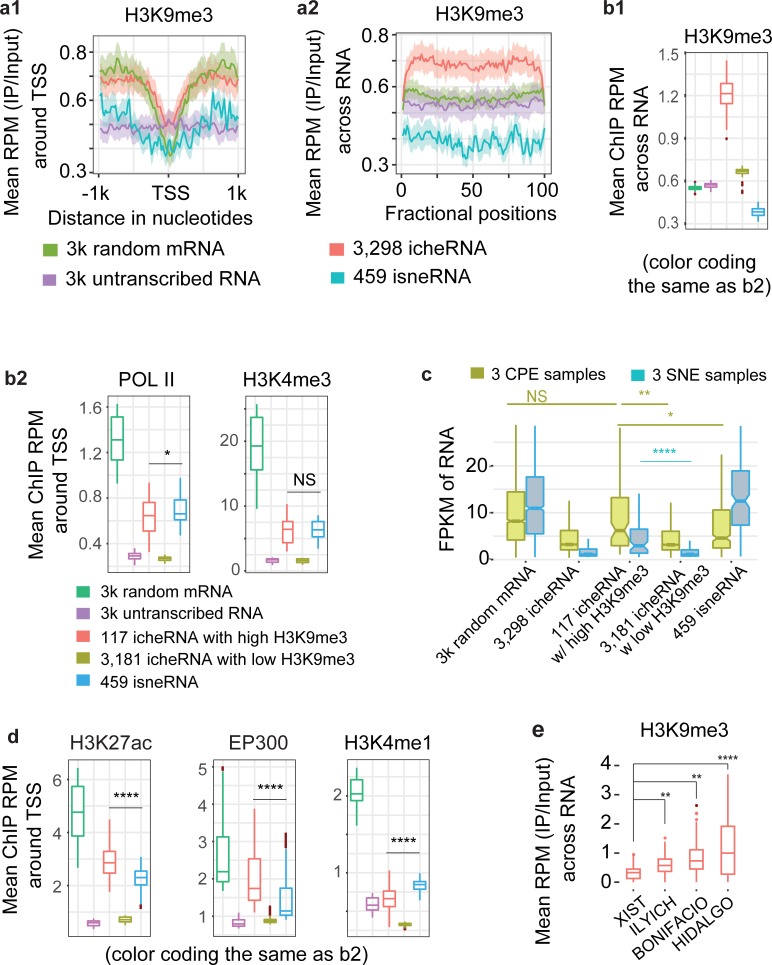
Fig 5. icheRNA with H3K9me3 signal concurs chromatin modification patterns of active enhancers.
a, Average H3K9me3 ChIP-seq read density versus input in K562 cells (a1) at promoters (±1kb centered at TSS) of, or (a2) across transcript bodies. b, Average ChIP-seq read density versus input in K562 cells of (b1) H3K9me3 profiles across regions transcribing, or (b2) POL II and H3K4me3 profiles at promoters (±1kb centered at TSS) of five classes of RNAs (decoded in colors). c, Normalized expression values in FPKM in chromatin pallet extract (CPE, red boxes) and soluble nuclear extract (SNE, blue) of K562 cells for randomly selected mRNA, icheRNA, icheRNA with high H3K9me3, icheRNA with low H3K9me3 and isneRNA. d, Average ChIP-seq read density in K562 cells of active enhancer marks (H3K27ac and EP300) and poised enhancer mark (H3K4me1) profiles at promoters (±1kb centered at TSS) of five classes of RNAs. e, Average H3K9me3 ChIP-seq read density versus input in K562 cells across regions transcribing four canonical cheRNAs. The four cheRNAs were ordered according to their known transcriptomic regulatory functions, from the repressor (XIST) on the left to other three cis-activators on the right. P-values calculated by two-sided Wilcoxon rank sum test, NS p>0.05, * p<0.01, ** p<1e-10, **** p<2.2e-16.

