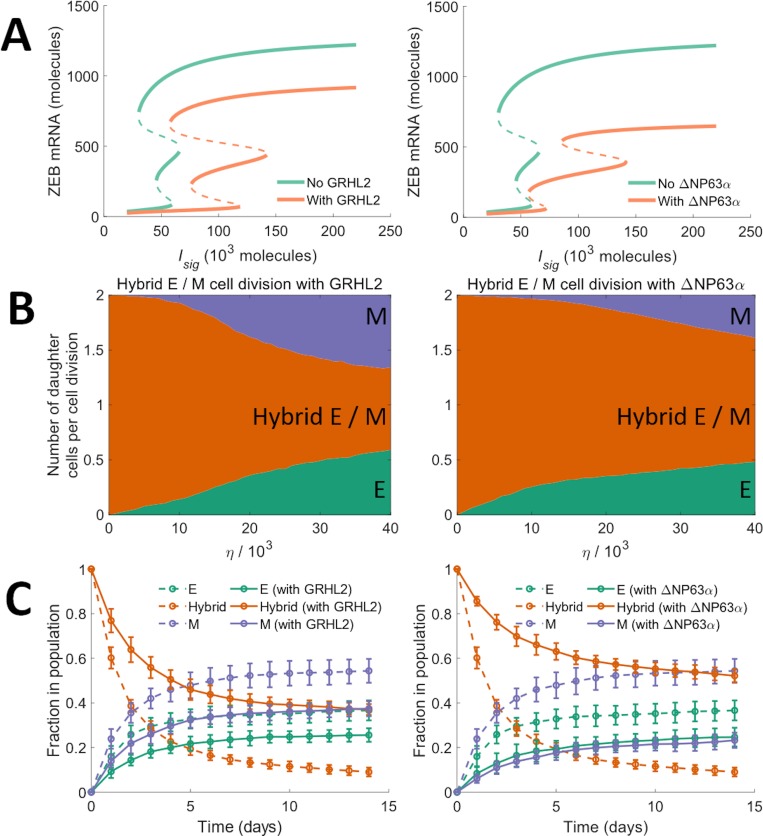
Fig 5. Model dynamics in the presence of EMT modulators.
(A) Bifurcation diagrams of the core EMP regulatory circuit in the presence of GRHL2 (left panel) and in the presence of ΔNP63α (right panel). (B) Average number of daughter cells of each phenotype generated per cell division during the division of a hybrid E / M cell in the presence of GRHL2 (left panel) and in the presence of ΔNP63α (right panel). (C) Fractions of different phenotypes, over time, in a population which consisted of only hybrid E / M cells on day 0. Solid curves in the left panel show the behavior in the presence of GRHL2 and solid curves in the right panel show the behavior in the presence of ΔNP63α. Dotted curves in left and right panels indicate the fractions of different phenotypes in the absence of GRHL2 and ΔNP63α activity respectively. Here, η = 2.7×10⁴ and the average doubling time of cells was 38.0 hours. The results shown in both panels were obtained by averaging over 16 distinct simulation runs. Error bars indicate the standard deviation calculated over the 16 independent runs.

