
Figure 1. FAPs Are Required for Efficient Skeletal Muscle Regeneration.
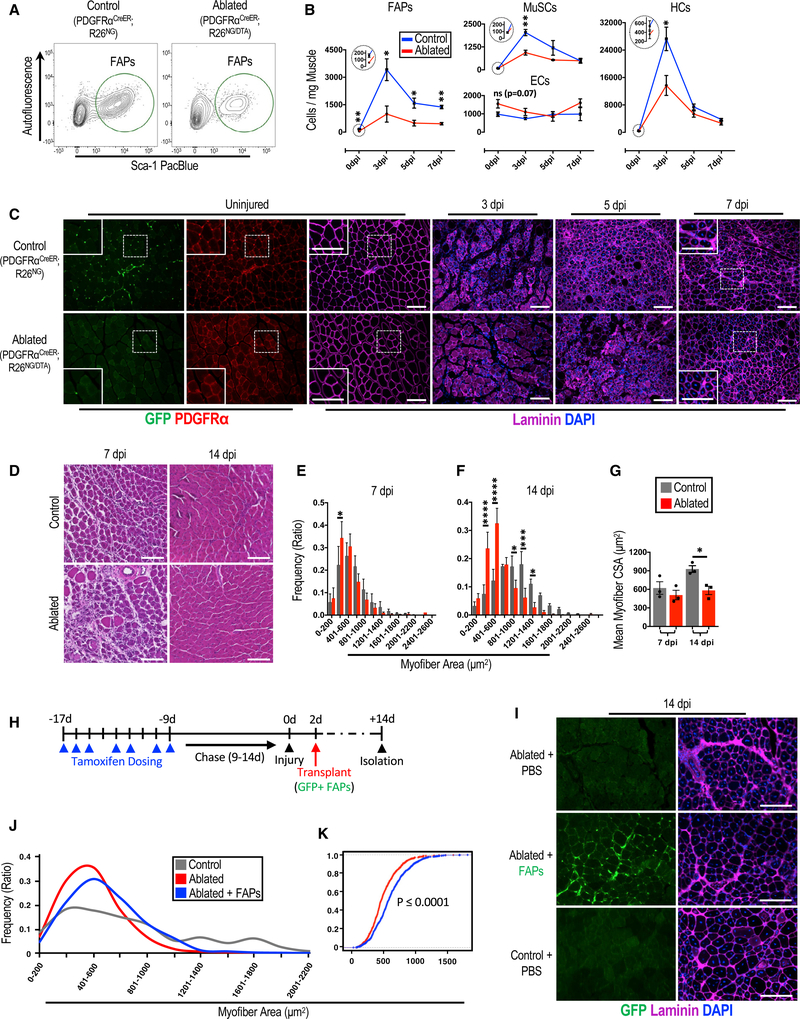
(A-C) The effects of depletion of FAPs on skeletal muscle.
(A) FACS plots showing the efficiency of ablating FAPs.
(B) A 7-day time course examining the influence of FAP ablation on the noted cellular fractions following skeletal muscle injury in ablated (PDGFRαCreER/+; R26NG/DTA or +/DTA) and control mice (n = 5–6 [0 dpi], 4–5 [3 dpi], and 3 [5 and 7 dpi]). The large circles are magnified views of areas in the small circles at 0 dpi for each respective graph.
(C) Immunofluorescence images of TA muscle cross sections from ablated and control mice corresponding to the time points in (B). Note the decrease in PDGFRα+ cells (punctate interstitial staining) in uninjured tissue from ablated mice and impaired myofiber necrosis and regeneration in the ablated tissue at 3 dpi and 7 dpi, respectively.
(D-G) Histological analyses of skeletal muscle regeneration from ablated and control mice.
(D) H&E staining of TA muscle cross sections from ablated and control mice at 7 and 14 dpi.
(E-G) Myofiber cross-sectional area (CSA) plotted as discrete sizes (E, 7 dpi; and F, 14 dpi) and overall means (G) (n = 3).
(H-K) Transplantation of FAPs into skeletal muscle of FAP-ablated mice to rescue regeneration impairment.
(H) Experimental design of the transplantation experiments.
(I) Immunofluorescent images showing GFP+ FAPs transplanted into the TA muscle.
(J) Quantification of myofiber CSAs from each experimental group, shown as a line histogram (n = 3).
(K) An empirical cumulative distribution function graph of all myofiber CSAs from the noted groups, with significance determined by a KS test (n = 681 [ablated] and 857 [ablated + FAPs]).
Scale bars, 100 μm. Error bars represent ± SEM. *p ≤ 0.05, **p ≤ 0.01, ***p ≤ 0.001, ****p ≤ 0.0001.