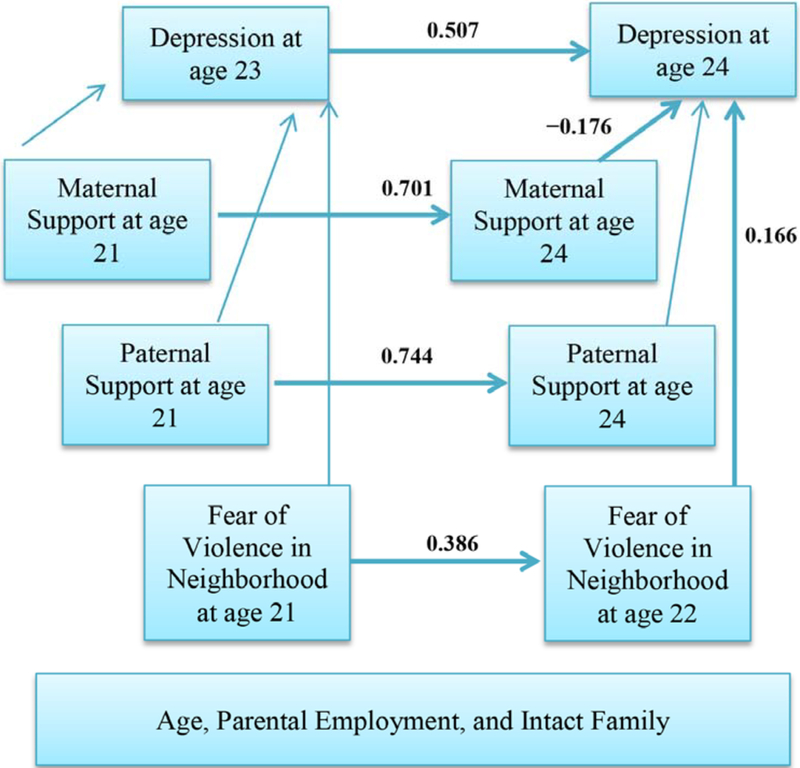
Figure 1.
Summary of path analysis among male African American youth. [χ2 = 82.126, df = 52, p = 0.005, χ2/df = 1.579, root mean squared error of approximation (RMSEA) = 0.029, (90% CI = 0.016, 0.041)]. Paths from covariates and also covariance between exogenous variables are not shown in this model. Numbers are standardized regression coefficients. Significant regression coefficients have been shown in bold.

