
Figure 1. Accurate mass metabolite annotations of m/z features significantly associated with PRAMGA-%Dis.
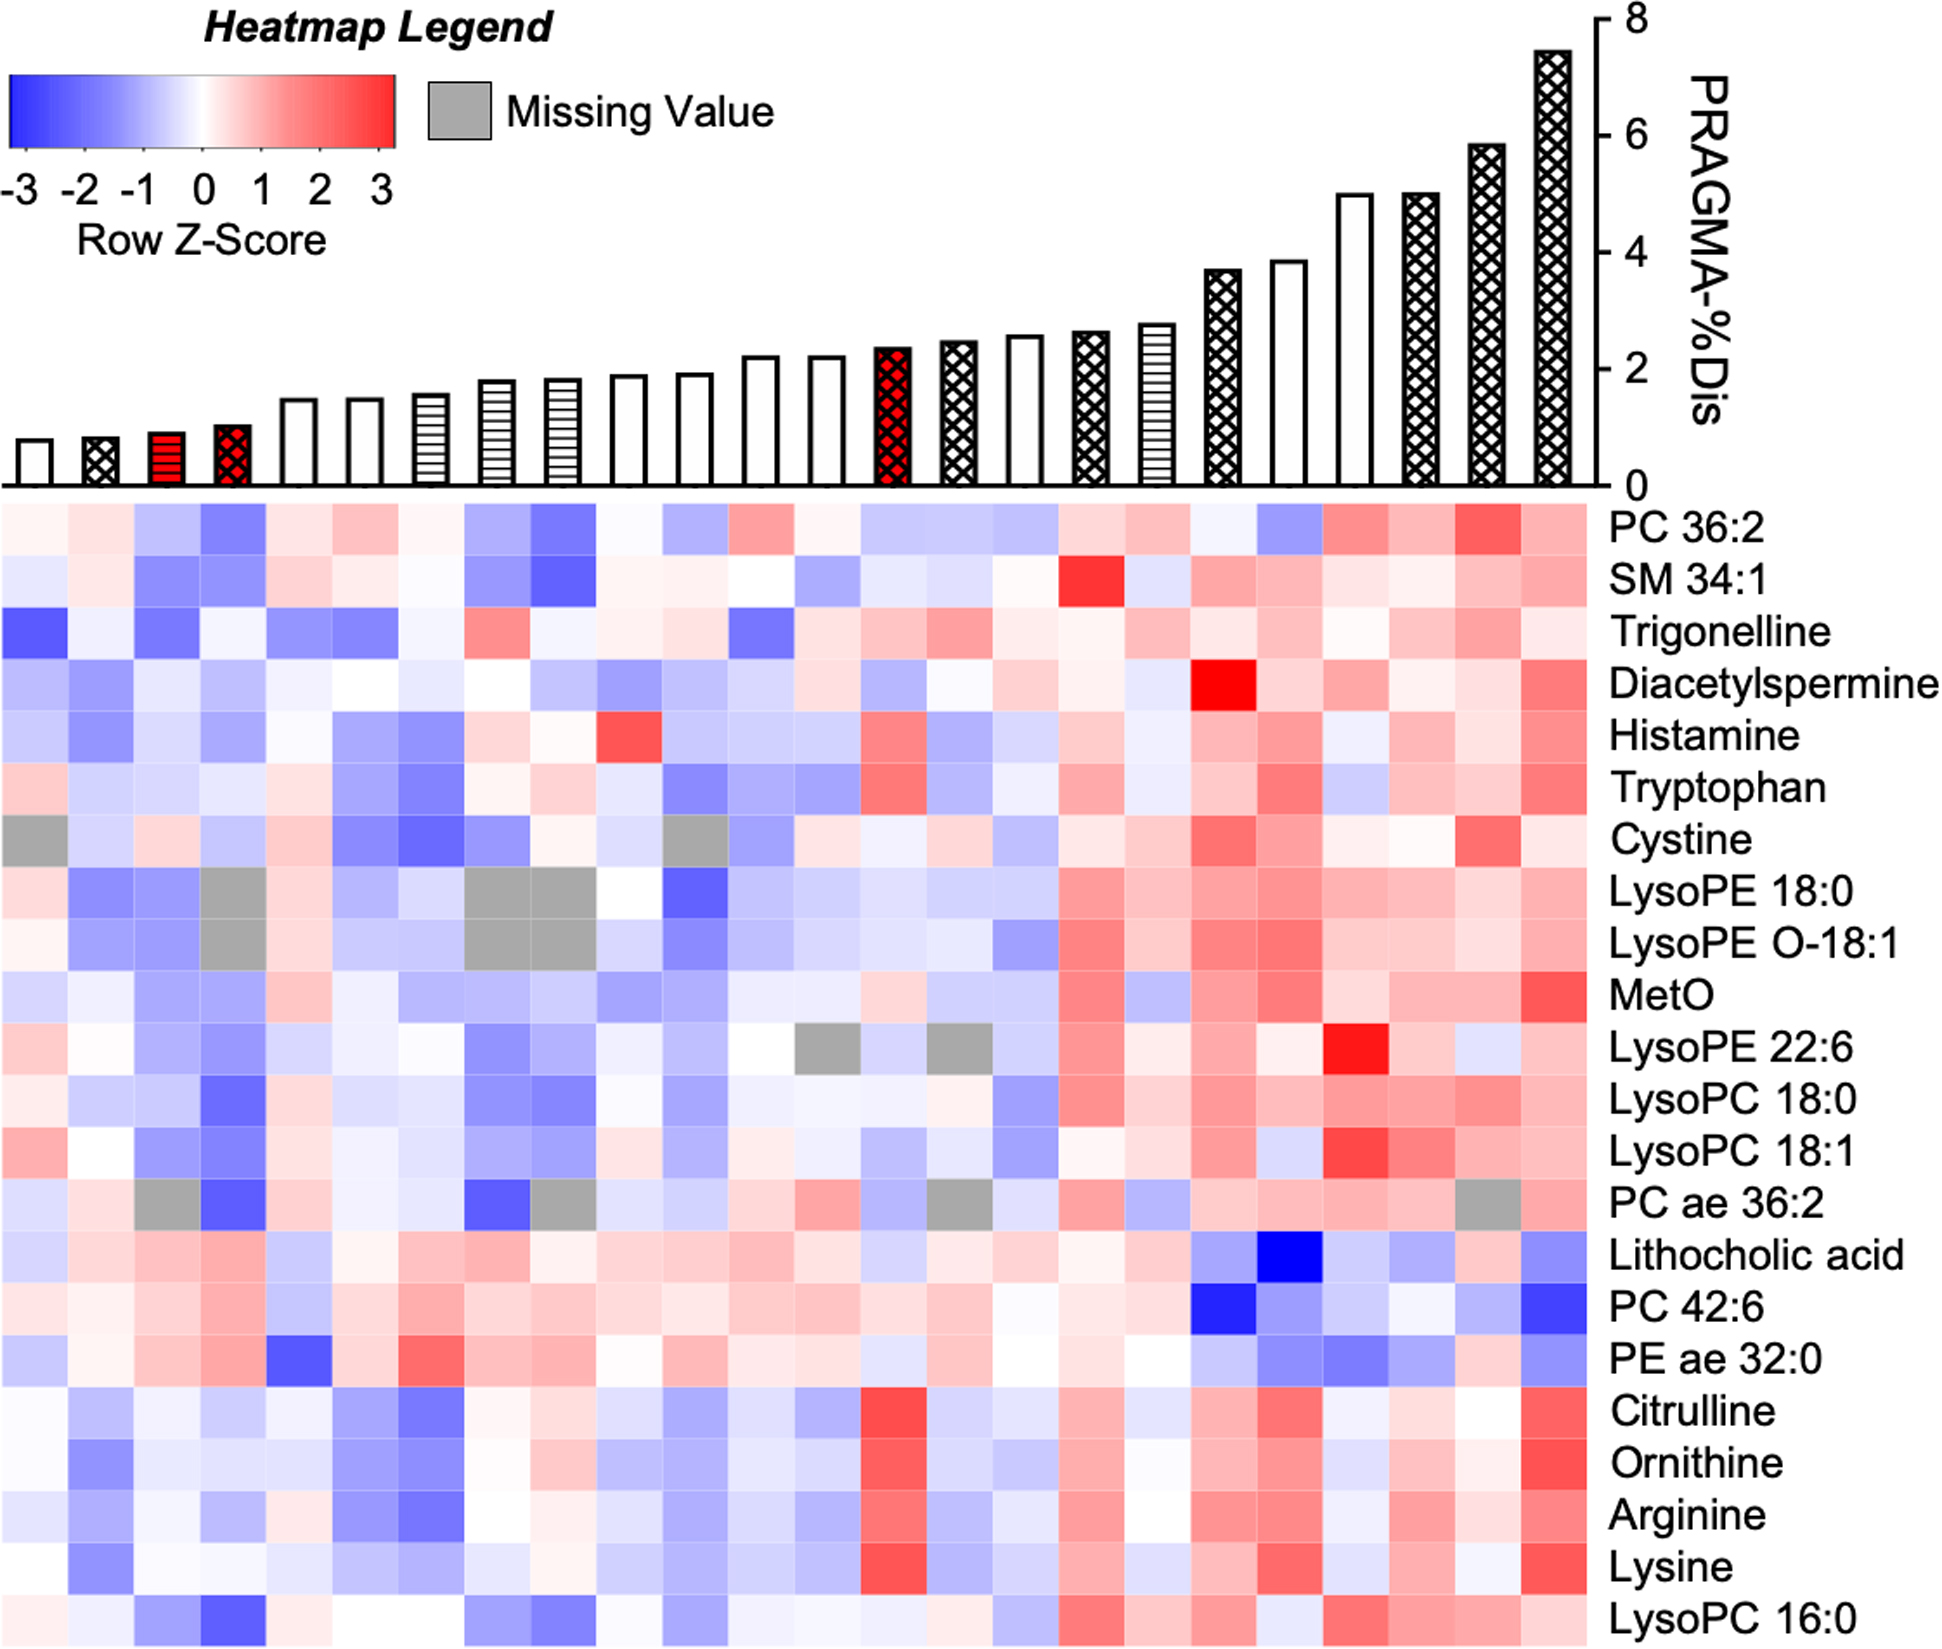
Intensities of m/z-by-retention time features measured from CF BALF by HRMS were log2-transformed, quantile-normalized and correlated with PRAGMA-%Dis using a linear model. Of 104 significant (p<0.05, q<0.25) features, 30 were annotated to accurate-mass matches using METLIN (13) followed by isotope analysis. These corresponded to 22 unique metabolites after deconvolution of co-eluting compounds (see also Table 2; and the complete dataset given in Supplementary File 2). The m/z feature with highest average intensity for each of the 22 metabolites was plotted on a heatmap, autoscaled to Z-scores and coded blue-(most negative)-to-red (most positive). Missing values are represented as gray. Columns were sorted from left-to-right by ascending PRAGMA-%Dis and rows were hierarchically clustered by metabolite intensities. Accurate mass metabolite matches are indicated to the right of the heatmap. PRAGMA-%Dis values corresponding to each patient are shown by a barplot above the heatmap. Bar color corresponds to disease state (white = CF, red = CFSPID). Bar fill corresponds to BAL microbe culture (no fill = no history of positive pathogen culture, diagonal lines = negative for pathogens at time of BAL, but a prior BAL was positive, and hatched = positive pathogen culture at time of BAL).