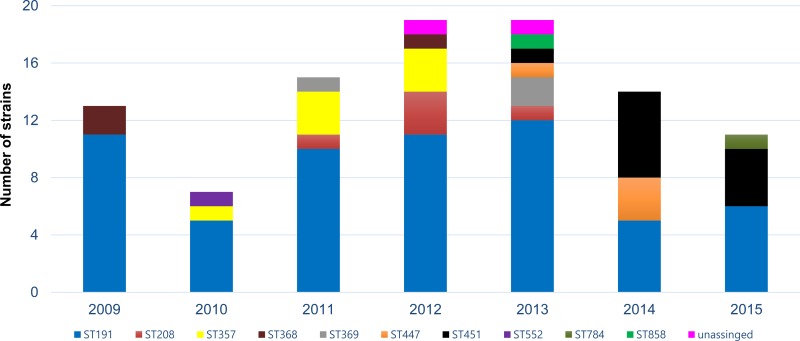
Fig 1. Distribution of carbapenem resistance A. baumannii isolates according to sequence types and year of isolation.
The isolates were typed by multi-locus sequence typing (MLST) using Oxford scheme and colored individually according to sequence type. Bar graph represents the individual and cumulative numbers of strains isolated each year.

