. 2020 Jan 15;9:e50901. doi: 10.7554/eLife.50901

Figure 5. TAPIN-seq complements single cell RNA-seq profiling.

(A, B) We evaluated whether single cell RNA-seq of the optic lobe (A) (Konstantinides et al., 2018) and brain (Davie et al., 2018) proportionally represents cell types found in the optic lobe. By comparing the single cell cluster sizes to the true abundance of each cell type (estimated as described in the Materials and methods) we found that the scRNA-seq map can both under- and over-estimate the abundance of each cell type (assuming accurate cell type labels), or that the cell type is incorrectly assigned (i.e. contains different or additional cell types). To estimate the true cell count, we made use of known anatomy (for example, several cell types are known to be present exactly once in each of the ~2×750 medulla columns per brain) or relied on published counts. In addition, we performed some new counts. (See Materials and methods for details.) Observed/expected ratio = ((size of cluster labeled as cell type X/size of cluster labeled as T1) / (true abundance of cell type X/true abundance of T1)). (C) We used non-negative least squares regression to model each TAPIN-seq profile as a linear weighted sum of single cell clusters in the whole brain scRNA-seq map. The heatmap represents the regression coefficients of each single cell cluster (rows) contributing to the TAPIN-seq profile of each cell type, normalized within rows. (D) We evaluated expression of genes that mark selected single cell clusters (Davie et al., 2018) in our TAPIN-seq profiles of visual system neurons. (see Figure 5—figure supplement 2 for the complete heatmap).

Figure 5.

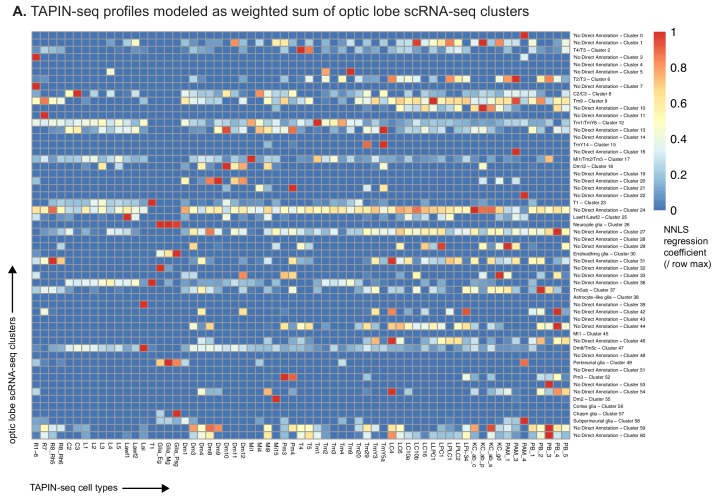
Figure 5—figure supplement 1. Regressing TAPIN-seq profiles against optic lobe single cell clusters.

Figure 5—figure supplement 1.

(A) We used non-negative least squares regression to model each TAPIN-seq profile as a linear weighted sum of optic lobe single cell clusters (Konstantinides et al., 2018). The heatmap represents the regression coefficients of each single cell cluster (rows) contributing to the TAPIN-seq profile of each cell type, normalized within rows.
Figure 5—figure supplement 2. TAPIN-seq expression of genes marking single cell clusters.

Figure 5—figure supplement 2.

(A) We evaluated expression of marker genes for each optic lobe single cell cluster (as reported in Konstantinides et al., 2018) in our TAPIN-seq profiles of visual system neurons. If a single cell cluster marker corresponds to one of our identified cell types, we expect to see its marker genes highly enriched in the corresponding cell type’s expression. Note that some of the single cell clusters with the best apparent cell type matches (e.g., cluster 15/TmY5a, cluster 55/Mi15) were originally reported with a different annotation. (B) Expression of marker genes for each brain single cell cluster (as reported in Davie et al., 2018), as in (A).
Figure 5—figure supplement 3. kn-GAL4 expression.

Figure 5—figure supplement 3.

(A) kn-GAL4 driven expression of a membrane-targeted GFP (green) in the optic lobe. Single confocal section with a reference marker (anti-Brp) in magenta. TmY14 cell bodies are unusual in that they are found only in a subregion of the medulla cell body rind (see http://flweb.janelia.org/cgi-bin/view_flew_imagery.cgi?line=R10G02 for an image of a GAL4 line that in the optic lobe expresses mainly in TmY14). Both the cell body distribution and optic lobe layer pattern (compare cells in (C)) indicate that kn-GAL4 is expressed in optic lobe cell types other than TmY14. (B) Stochastic labeling of kn-GAL4 neurons using MCFO. A TmY5a cell and an LC4 cell are indicated. Other cell types, including several TmY14, are also labeled. Image shows a single confocal section without a reference marker. (C,D) Examples of TmY14 (C) and TmY5a (D) cells. Reconstructed views generated from confocal stacks of MCFO-labeled cells using the indicated driver lines.