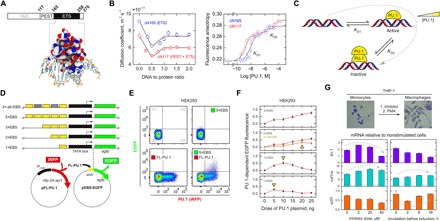
Fig. 1. PU.1 transactivation is regulated by negative feedback.

(A) The ETS domain (ΔN165) is the only structured and minimal DNA binding unit (PDB: 1PUE). (B) Left: DOSY NMR titrations of ΔN117 and ΔN165 with cognate DNA yielding equivalence points at DNA:protein = 0.5 and 1.0, corresponding to 2:1 and 1:1 complexes, respectively. The absence of single global minima at DNA:protein = 1:1 formally excludes the possibility of a 2:2 complex. Right: Fluorescence anisotropy titrations with labeled cognate DNA. Both ΔN117 and ΔN165 form a 2:1 complex at a single DNA site with different negative cooperativity as defined by the ratio of the two sequential dissociation constants KD1 and KD2 (dashed lines; see Materials and Methods). Parametric values are given in table S1. (C) Scheme of negative feedback in PU.1 trans-regulation. A mechanistic link between dimerization and negative feedback predicts a reduction in PU.1 activity under conditions permissive of an inactive 2:1 complex. (D) Synthetic PU.1-dependent EGFP reporters. A minimal TATA box was driven by enhancers composed only of tandem EBS (yellow blocks) spaced 20 bp apart. Hatched blocks represent mutated sites. (E) Representative flow cytometric data of untreated HEK293 cells and upon transfection with a constant dose of the 5×EBS reporter and/or up to 25 ng of an expression plasmid encoding full-length PU.1 (see Materials and Methods). Quadrant Q2 contained the EGFP-positive cells to be counted out of all PU.1-expressing cells (Q2 + Q3). (F) EGFP fluorescence in Q2 taken over the summed fluorescence in Q2 + Q3 at 24 hours after cotransfection of the EGFP reporter plasmid and the indicated dose of PU.1 expression plasmid. Each data point represents the means ± SE of triplicate or more samples. (G) RT-PCR measurements of pu.1, csf1ra, and e2f1 mRNA abundance (relative to gapdh) in THP-1 cells induced with PMA following exposure to either doses of a PU.1 inhibitor for 2 hours (left) or a fixed dose of 20 μM inhibitor for various periods (right). Cells were visualized at ×40 magnification after Giemsa staining.
