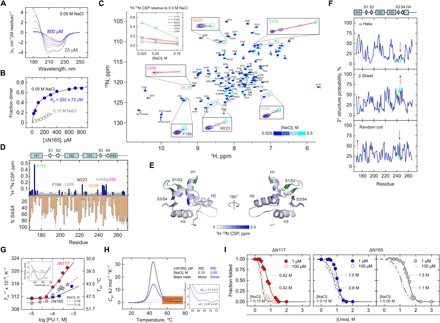
Fig. 5. Dimerization of the DBD of PU.1 is electrostatically mediated and conformationally destabilizing.

(A) CD-detected titration of ΔN167 at 50 mM NaCl from 25 to 800 μM. (B) Analysis of the titration by singular value decomposition yields a two-state transition with a dissociation constant K2 of 202 ± 72 μM. (C) 1H-15N HSQC as a function of salt from 25 to 500 mM NaCl. Residues with the strongest 1H-15N CSPs (Y173, M223, G239, V244, and L248) are boxed. Inset: Salt dependence of the CSPs of these residues. (D) Summary of the residue CSPs with the average %SASA from the unbound NMR monomer, 5W3G. Residues above a 0.5-ppm cutoff are colored in dark blue, and the subset of internal residues (<35% SASA, based on the termini) is marked with yellow circles. Residues implicated in the DNA-bound dimer are marked with green circles. (E) Mapping of the high-CSP residues to 5W3G. Green residues mark known residues involved in the DNA-bound dimer (20). (F) Chemical shift–derived secondary structure prediction via the CSI using 1H and 15N signals. The color scheme follows the HSQC in (C). Regions with significant changes in secondary structure are marked by arrows. (G) Near-UV CD-detected thermal melting of ΔN117 and ΔN165. Two salt concentrations were evaluated for ΔN165 (blue and gray). Inset: Representative near-UV CD spectra. (H) DSC thermograms (solid) for ΔN165 under conditions (salt and concentrations) in which the protein was primarily monomeric or dimeric. The ΔCp values are given in kJ (mol monomer)−1 K−1. Dashed curves represent the two-state transition for a monomer (black) and dimer (blue). (I) Trp fluorescence-detected denaturation by urea of ΔN117 and ΔN165 at two monomer concentrations. Curves represent fit to the linear extrapolation model for a two-state dimer. The marked concentrations represent urea concentration at 50% unfolding.
