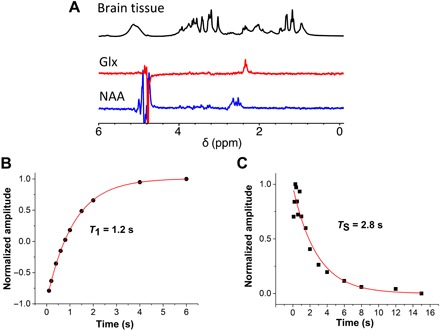
Fig. 3. Analyzing metabolites in the brain via singlet states.

(A) Top to bottom: the 1H NMR spectrum of ex vivo mouse brains (128 scans, spectrum is divided by 32) and the corresponding singlet-filtered NAAβ and Glxγ spectra (128 scans, acquisition time ~3 min). In all the spectra, a polynomial pulse sequence was appended for water suppression. All experiments have been conducted at 7.05 T (300 MHz). The experimental parameters for the sequence are reported in table S4. The composition of the buffer is reported in the Supplementary Materials. (B) T1 of the Glx signal and (C) TS, displaying long-lived behavior.
