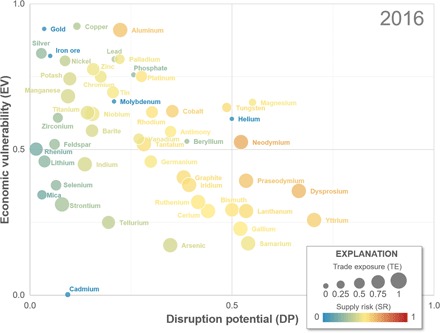
Fig. 2. Assessment of SR for year 2016.

DP (horizontal axis), EV (vertical axis), TE (point size), and SR (point shade) are shown. For some commodities, indicator scores are rounded to avoid disclosing company proprietary data.

DP (horizontal axis), EV (vertical axis), TE (point size), and SR (point shade) are shown. For some commodities, indicator scores are rounded to avoid disclosing company proprietary data.