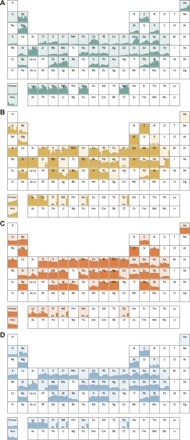
Fig. 3. SR by indicator for years 2007–2016.

DP (A), TE (B), EV (C), and SR (D) scores for all commodities examined for the years 2007–2016 are shown. For each box, the vertical axis represents scores ranging from 0 to 1, while the horizontal axis represents the years 2007–2016. No results are available for tellurium (Te) before 2011 or neodymium (Nd), praseodymium (Pr), samarium (Sm), and dysprosium (Dy) before year 2015, as indicated by “NA” in their box. For some commodities, indicator scores are rounded to avoid disclosing company proprietary data.
