Figure 3.

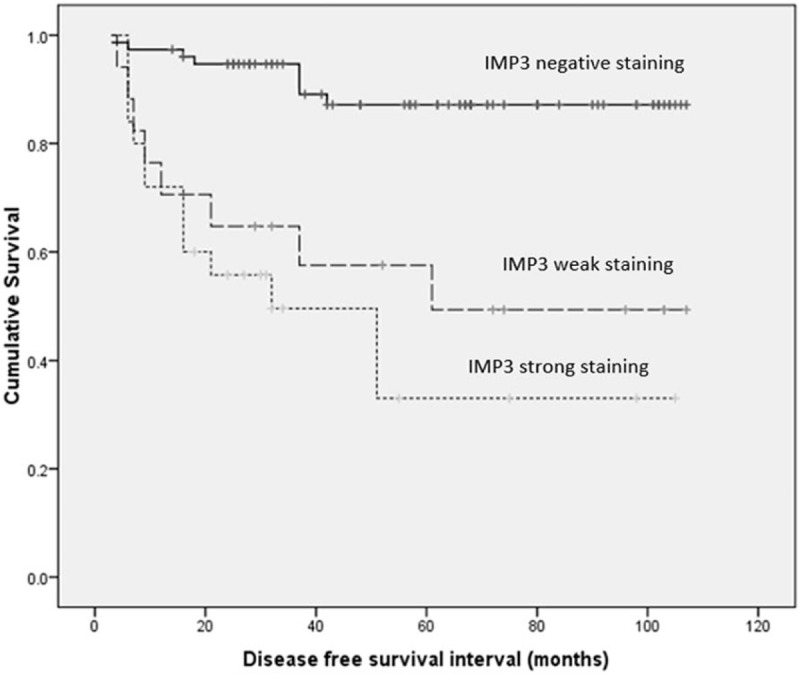
Kaplan–Meier curve for DFS interval for IMP3 (solid line: negative staining, dashed line: weak positive staining; dotted line: strong staining). DFS = disease-free survival, IMP3 = insulin-like growth factor II mRNA binding protein 3.

Kaplan–Meier curve for DFS interval for IMP3 (solid line: negative staining, dashed line: weak positive staining; dotted line: strong staining). DFS = disease-free survival, IMP3 = insulin-like growth factor II mRNA binding protein 3.